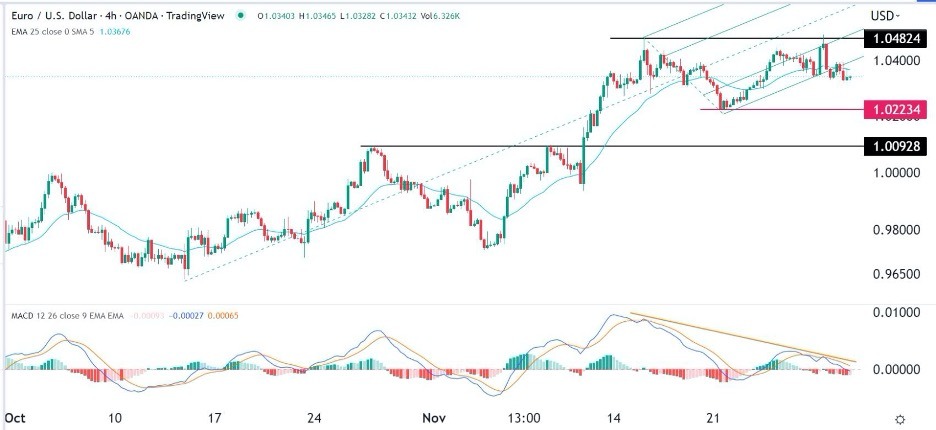
Bearish view
- Sell the EUR/USD pair and set a take-profit at 1.0223.
- Add a stop-loss at 1.0350.
- Timeline: 1-2 days.
Bullish view
- Buy the EUR/USD pair and set a take-profit at 1.0500.
- Add a stop-loss at 1.0280.
The EUR/USD price dropped slightly as demand for US dollars rose after the encouraging consumer confidence data. It also pulled back ahead of key economic numbers from the US like jobs and GDP. Eurostat will also publish the preliminary inflation data. It was trading at 1.0333 on Wednesday, slightly lower than this month’s high of 1.0500.
EU inflation and US GDP data ahead
The euro declined slightly after Germany entered a Liquified Natural Gas (LNG) deal with Qatar. The two sides agreed that Germany will buy at least 2 million tonnes of LNG every year starting from 2026. Germany and other European countries are working to reduce their gas exposure from Russia following the invasion of Ukraine.
The agreement came on the same day that Germany published encouraging preliminary inflation data. According to Destatis, consumer prices in Germany declined from 0.9% in October to -0.5% in November. On a year-on-year basis, inflation dropped from 10.4% to 10.0% as natural gas prices retreated.
The EUR/USD price will react to the upcoming inflation estimate from the euro area. Economists expect that the bloc’s inflation dropped from 10.6% to 10.4%. Excluding food and energy, they expect that inflation dropped to 6.3%. As such, there are signs that inflation has peaked.
The other important catalysts for the pair will be the latest economic data from the US. ADP Research will publish the latest nonfarm employment change data. Economists expect that the economy created over 200k jobs in November.
The data will come two days ahead of the official NFP numbers, which most investors will pay a close attention to. The Bureau of Labor Statistics (BLS) will publish October’s job openings numbers. Further, the US will release the second estimate of Q3’s GDP numbers.
EUR/USD forecast
The EUR/USD price declined from this month’s high of 1.0482 to 1.0340. On the 4H chart, it formed a double-top pattern, which is usually a bearish sign. It declined below the 25-period moving average while the MACD formed a bearish divergence pattern. The pair also moved slightly below the lower side of the Andrews Pitchfork indicator.
Therefore, the pair will likely continue falling as sellers target the next key support point ay 1.022, which is the neckline of the double-top pattern. A move above the resistance at 1.0482 will invalidate the double-top pattern.
 Ready to trade our free daily Forex trading signals? We’ve shortlisted the best Forex brokers in the industry for you.
