Bullish view
- Buy the GBP/USD pair and set a take-profit at 1.1950.
- Add a stop-loss at 1.1800.
- Timeline: 1 day.
Bearish view
- Set a sell-stop at 1.1812 and a take-profit at 1.1750.
- Add a stop-loss at 1.1900.
The GBP/USD price has moved sideways in the past few days after a series of mixed economic data and the British autumn statement. It was trading at 1.1880, which is slightly below this month’s high of 1.2027. The pair is about 6.58% above the lowest level this month.
UK autumn statement and data
The GBP/USD price had an eventful week as Jeremy Hunt read his autumn statement last Thursday. In it, he warned that the UK was in a recession even as he expects the economy to grow by 4.2% this year. It will then shrink by 1.4% in 2023 and then rise by 1.3% in 2024 and 2.6% in 2025.
The UK government borrowing will be 7.1% of GDP while the budget deficit will be about 99.1 billion in cash terms. He expects that the borrowing will be halved by his statement. This will happen because of a combination of low government spending and higher taxes.
The statement came a day after the UK published high consumer and producer inflation data. The numbers showed that the headline consumer inflation rose to a multi-decade high of 11.1%. This increase was higher than what analysts were expecting.
Additional data showed that the volume of retail sales rose by 0.6% in October compared to September. This increase was double the 0.3% that most analysts were expecting. Retail sales volumes dropped by 2.4% in three months to October. The decline was mostly because many companies closed during the Queens funeral.
There will be no economic data from the UK and the US. Therefore, investors will likely continue focusing on the potential actions by the Federal Reserve and the Bank of England. Analysts expect that the two banks will slow the pace of increases in the coming months.
GBP/USD forecast
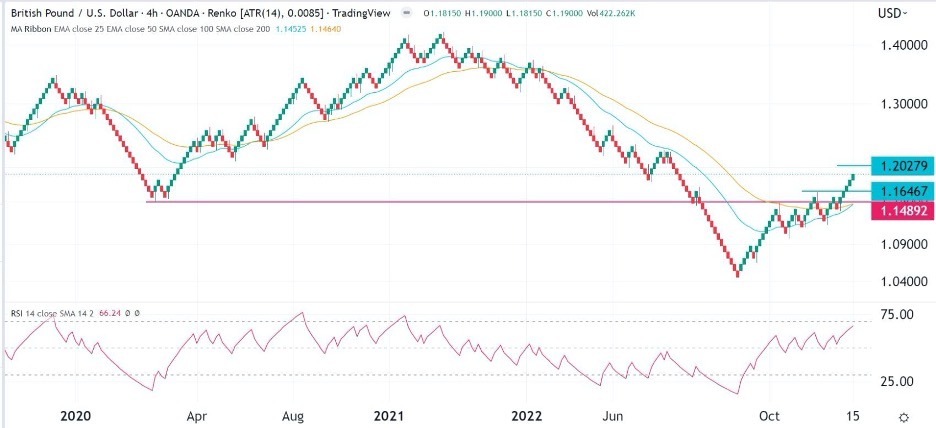
The four-hour chart Renko chart shows that the GBP/USD price has been rising. The bars have risen in the past five consecutive bars. It has moved above the important resistance level at 1.1646. Also, the 25-day and 50-day moving averages have made a bullish crossover. The pair has also risen above 1.1490, the lowest point on March 20.
Therefore, the renko chart shows that the pair will likely keep rising as buyers target the key level at 1.1950.

Ready to trade our daily trading signals? Here’s a list of some of the best Forex trading platforms to check out.
