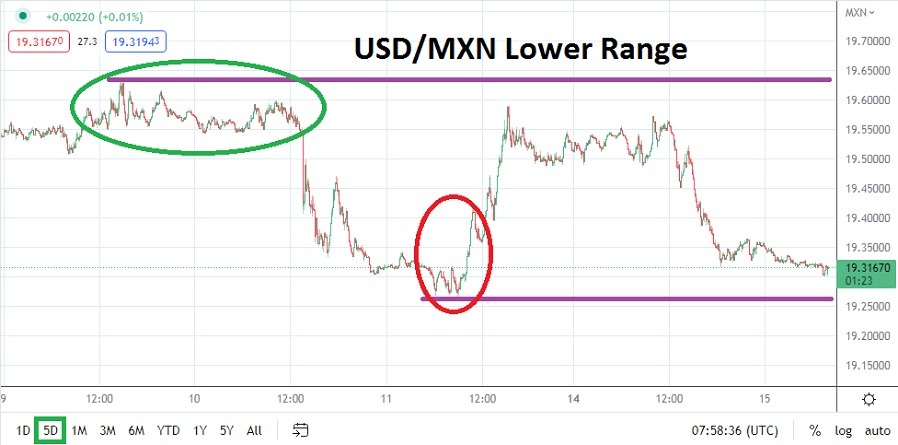
Traders of the USD/MXN are likely studying long-term charts as they consider the possible depths the currency pair could explore in the near-term. As of this writing the USD/MXN is traversing near the 19.32500 ratio with fast price action evident. The lower depths of the USD/MXN have been achieved after the currency pair fell to a low of nearly 19.26400 this past Friday, then reacted with a violent reversal higher to almost 19.600 before stumbling into the weekend near 19.50000.
Violent Trading as USD/MXN Reacts to Fundamentals and Technical Pressures
The USD/MXN has stood out as one of the few Forex pairs that have not seen the USD dominate price action the past year. The USD/MXN has done well because the Mexican Peso has certainly been bolstered by strong energy prices. Yes, the interest rate policy of the U.S Federal Reserve has factored into trading mechanics in the USD/MXN. However, the counterweight of high Crude Oil prices has balanced the currency pair and in fact made a bearish sentiment worthy of wagering.
U.S Inflation Numbers Came in Weaker than Expected Last Week
Bearish speculators were given another boost last week for the USD/MXN when U.S CPI data came in weaker than expected. The notion that inflation may be finally starting to lessen certainly ignited more selling in the USD/MXN. The currency pair was near the 19.60000 level this past Thursday and by Friday had witnessed a depth of value not seen since March of 2020. It should be noted March 2020 was when the USDS/MXN was rising due to coronavirus chaos and the currency pair was in a bullish mode. The USD/MXN was trading near the 18.51 ratio in February of 2020.
- Key support levels are now being flirted with as the USD/MXN trades above the 19.30000 level. If this juncture proves vulnerable and prices are sustained below, it could be a signal additional selling could escalate.
- The rise in value back to 19.60000 on Friday on the reversal off the lows, then followed by more selling illustrated that resistance may prove durable. If the 19.40000 level holds as resistance this could be interpreted as the start of a lower price range via technical perceptions.
Traders who want to wager on more downside price action for the USD/MXN cannot be blamed. However the USD/MXN does have a habit of abruptly producing reversals as its tests its price range. If current resistance holds and the USD/MXN incrementally moves lower, traders may want to target nearby support ratios they feel are legitimate targets. The 19.29900 to 19.28800 could prove worthwhile for wagers in the near-term.
USD/MXN Short-Term Outlook:
Current Resistance: 19.37100
Current Support: 19.30100
High Target: 19.46970
Low Target: 19.24900
 Ready to trade our Forex analysis today? We’ve made a list of the best brokers to trade Forex worth using.
