Bullish view
- Buy the BTC/USD pair and set a take-profit at 18,000.
- Add a stop-loss at 16,500.
- Timeline: 1-2 days.
Bearish view
- Sell the BTC/USD pair and set a take-profit at 16,000.
- Add a stop-loss at 18,000.
The BTC/USD price continued to consolidate during the weekend amid signs that investors were withdrawing their coins in record numbers. Bitcoin was trading at $17,153, where it has been in the past few weeks.
Crypto investors fleeing
Bitcoin price has moved sideways in the past few weeks as the market reflects on the collapse of FTX, the second-biggest exchange in the world by valuation. At its peak, FTX was processing billions of dollars on a daily basis and was one of the most trusted names in the industry. Now, the company has an $8 billion hole in its balance sheet.
There are signs that investors are exiting their positions. In November, investors pulled 91,363 bitcoins from exchanges at an average price of $16,400. This means that most of investors exited their positions at a big loss. It was also the biggest bitcoin outflow on record. While some of these coins moved to private wallets, others were being sold.
Outflows have been increasing in the past few months amid rising concerns in the industry, including the collapse of Celsius, Voyager Digital, and Terra. However, these collapses will likely have a positive impact in the industry in the long term.
For one, following Sam Bankman-Fried’s interviews, it has become clear that he was running a crime since funds from FTX were being used to support Alameda Research’s operations. Therefore, there is a likelihood that regulators will come up with guidelines for the sector.
The next key catalyst for the BTC/USD price will be on Wednesday when the US will publish its inflation data and the Fed makes its decision. Economists expect the data to show that the headline inflation to drop from 7.7% to 7.3%. The Fed will likely hike rates by 0.50% after hiking by 0.75% in the past four meetings.
BTC/USD forecast
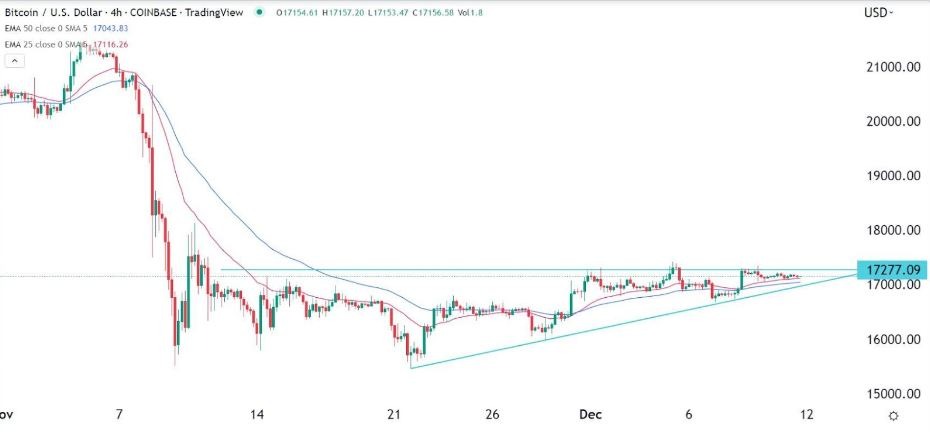
The 4H chart shows that the BTC/USD price has been in a consolidation phase in the past few weeks. It has moved slightly above the 25-day and 50-day moving averages. The pair has found a strong resistance point at 17,277, where it has struggled moving above in the past few weeks.
It has also formed an inverted head and shoulders pattern, which is usually a bullish view. The pair has also formed an ascending triangle pattern. Therefore, the pair will likely continue rising as buyers target the key resistance point at 18,000.
Ready to trade our free trading signals? We’ve made a list of the best Forex brokers worth trading with.

