Bearish view
- Sell the BTC/USD pair and set a take-profit at 17,200.
- Add a stop-loss at 19,500.
- Timeline: 1 day
Bullish view
- Set a buy-stop at 18,400 and a take-profit at 20,000.
- Add a stop-loss at 17,000.
The BTC/USD price recovery eased slightly after the Federal Reserve downshifted its policies. Bitcoin moved slightly below $18,000 after the relatively hawkish policy. It has soared by more than 18% from its lowest level as signs of a bear market capitulation emerge.
Federal Reserve downshifts
Bitcoin pulled back slightly as investors reacted to the latest Federal Reserve policy. As was widely expected, the Federal Reserve decided to hike interest rates by 0.50% in its final meeting of the year. It had hiked by 0.75% in the past four straight meetings as it battled soaring inflation.
In its statement, the Fed welcomed the recent trends in inflation but warned that the battle was still on. After peaking at 9.1% earlier this year, consumer prices dropped to 7.1% in November, signaling that the Fed’s policies are working. Still, inflation remains at an uncomfortable level, which means that the Fed has more work to do.
Bitcoin also rose as investors reacted to the recent happenings in FTX. Sam Bankman-Fried was arrested on Monday and presented to court on Tuesday. He will remain in prison until February when the court will start listening to his extradition issues.
Analysts expect that FTX’s collapse will lead to significant regulations in the United States. Already, officials are investigating Binance, the biggest crypto exchange in the world. The company is being investigated for committing several crimes, including mony laundering.
As a result, these red flags pushed crypto holders with Binance to sell billions of coins in the past few days. On Tuesday, they sold coins worth over $3 billion as contagion risks rose. According to DeFi Llama, some of the customers started returning, with inflows of about $1 billion.
BTC/USD forecast
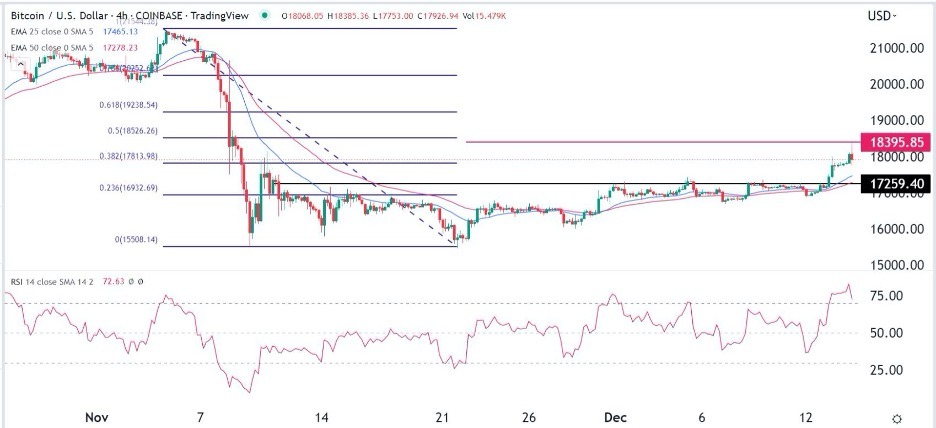
The BTC/USD price crossed the important resistance at 18,000 on Wednesday. As it rose, it moved above the crucial resistance point at 17,260, which was the neckline of the inverted head and shoulders pattern. The upward trend is supported by the 25-day and 50-day moving averages while the Relative Strength Index (RSI) moved to the overbought level. It also retested the 50% Fibonacci Retracement level.
Therefore, the pair will likely retreat and retest the support at 17,260 and then resume the bullish trend. If this happens, the next key level to watch will be the psychological level of 19,000.
 Ready to trade our daily Forex signals? Here’s a list of some of the best Forex brokers to check out.
