Bearish view
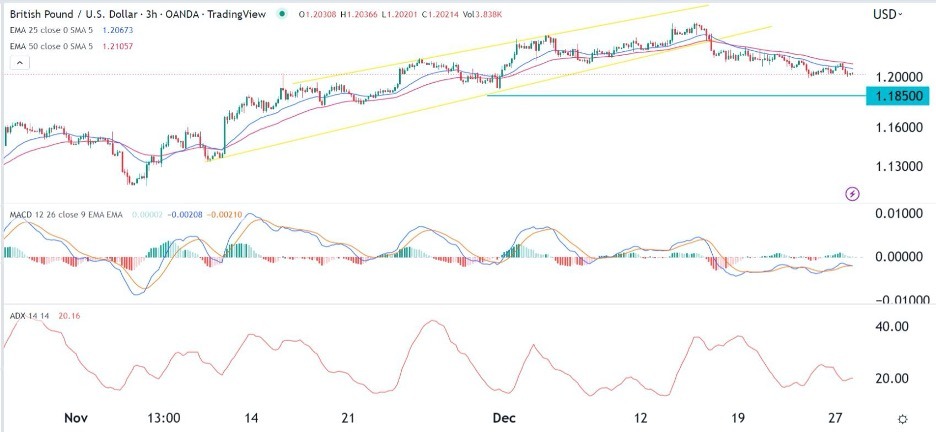
- Sell the GBP/USD pair and set a take-profit at 1.1850.
- Add a stop-loss at 1.2050.
- Timeline: 1-3 days.
Bullish view
- Set a buy-stop at 1.2100 and a take-profit at 1.2200.
- Add a stop-loss at 1.1900.
The GBP/USD exchange rate continued its bearish trend as the divergence between the US and UK continued. Sterling dropped to a low of 1.2030 as the sell-off that started on December 14 continued amid low volumes.
UK and US divergence
The US and UK have emerged from the pandemic differently. Recent data shows that the UK’s economy was recovering at a slower pace than most developed countries. Data published last week showed that the economy contracted by 0.3% in the third quarter, meaning that it remains below pre-pandemic levels.
The economy will likely continue worsening in the coming months as workers in important sectors of the economy stage regular walkouts. Some of the striking workers are nurses, rail, and postal service. Analysts expect that these strikes will have a 0.1% impact on the GDP.
The US, on the other hand, is recovering at a faster pace than the UK and other developed countries. Its economy expanded by 3% in the third quarter while inflation continued dropping. Therefore, the Fed has more flexibility in its monetary policy.
The GBP/USD pair dropped as oil prices rose following Putin’s decision to ban oil exports to non-friendly countries. He attributed the ban to the recently passed oil supply cap by the EU, the US, and the UK. While these countries are no longer importing oil from Russia, the impact is that prices could continue rising since Russia is one of the biggest oil exporters.
The GBP/USD price dropped even as numbers revealed that America’s house prices were falling. House prices declined for four straight months as mortgage rates rose. Economists believe that this trend will continue in 2023 especially when the Fed continues hiking interest rates.
There will be no economic data from the UK on Wednesday. And from the US, the only important number will be the latest pending home sales numbers.
GBP/USD forecast
The 3H chart shows that the GBP/USD price has been in a strong sell-off in the past few days. As it dropped, it moved below the 25-day and 50-day moving averages while the Average Directional Index (ADX) drifted downwards. The pair is also slightly above the psychological level of 1.200 while the MACD moved below the neutral point.
Therefore, the pair will likely continue falling as sellers target the next key support level at 1.1850. A move above the resistance point at 1.2050 will invalidate the bearish view.
 Ready to trade our free daily Forex trading signals? We’ve shortlisted the best Forex brokers in the industry for you.
