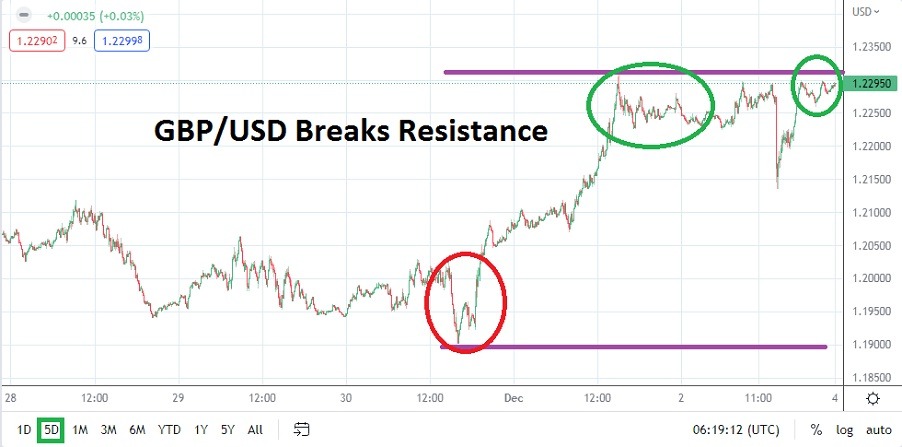
The GBP/USD reached new mid-term highs as it broke through the technically perceived resistance of its August values, and traders now consider the potential of higher price junctures.
The GBP/USD went into the weekend near the 1.22950 mark; this is quite a positive achievement considering the currency pair was near the 1.03950 realms on the 26th of September. The move upwards has occurred as the U.K. government has put into order political chaos within its ruling party and the U.S. has Federal Reserve has confirmed it will consider the potential of a more dovish interest rate policy. A nearly 20% gain within the GBP/USD since late September is quite a move higher.
A low for the GBP/USD last week flirted with the 1.19000 level on Wednesday but buying suddenly erupted when U.S Fed Chairman Powell acknowledged in a speech the U.S central bank needs to take into consideration the weakening U.S economy. Technical traders who were GBP/USD buyers at the lows likely were rewarded as the currency pair closed on Friday while flirting with short-term highs again.
Year Technical Charts will be Useful for GBP/USD Speculators
A glance at a six-month chart of the GBP/USD clearly indicates the currency pair is traversing ratios last seen on the 1st of August 2022. While that is enticing enough, speculators who are technically inclined and those who may want to consider what behavioral sentiment is hoping for regarding more upwards results should look at one-year charts.
- The 1.23000 resistance level looks to be important for short-term traders and also financial houses with longer ambitions. The last time the 1.23000 level saw sustained trading and above was in late June of this year.
- The powerful move higher in the GBP/USD will not be a one-way ride upwards, traders need to remain realistic and use risk management. The GBP/USD is being driven higher most likely by outlooks in financial institutions.
Last Week’s GBP/USD Low a Reminder of Dangers Reversals Pose for Day Traders
While the GBP/USD has been climbing incrementally higher, day traders can still be confronted by reversals lower which can test wagers that are using too much leverage. Picking the exact moment the GBP/USD is going to get a strong amount of buying is a dangerous game and can lead to expensive losses.
The GBP/USD dropped to 1.19000 on Wednesday. After touching the 1.21200 level on Monday, the GBP/USD moved lower to 1.19400 a handful of hours later. On Tuesday the GBP/USD climbed again only to stumble to Monday’s lows again. Wednesday’s lowest depths had not been seen since the 23rd of November.
GBP/USD Weekly Outlook:
The speculative price range for GBP/USD is 1.20510 to 1.24770
Support has incrementally risen since the 3rd of November. Technically it seems as if the GBP/USD may be ready to sustain higher support levels. However, if the GBP/USD were to suffer selling early tomorrow and have it persists into Tuesday, the 1.22000 to 1.21000 ratios could certainly see downward pressure applied.
The upwards momentum in the GBP/USD is not guaranteed and some financial houses may believe the gains were achieved too fast. If the 1.21000 level proves vulnerable a test of the 1.20500 could prove to be important. Traders may feel inclined to pursue buying positions of the GBP/USD if the lower support level gets a serious challenge if they remain bullish.
Economic conditions are difficult and the U.K is certainly not about to start a celebration parade proclaiming solid economic results are coming. However, Forex trading has a lot to do with the sentiment of the crowd. Nervous conditions in the GBP/USD do remain, but the ability of the currency pair to put in a solid move higher and re-establish its values not seen since early August is noteworthy in a positive manner. If current support levels prove durable, the GBP/USD may continue to see some buying action based on the notion that the 1.23000 to 1.24000 levels are solid targets and reasonable value under present conditions.

Ready to trade our weekly Forex forecast? Here are the best Forex brokers to choose from.

