Bullish view
- Buy the GBP/USD pair and set a take-profit at 1.2435.
- Add a stop-loss at 1.2350.
- Timeline: 1-2 days.
Bearish view
- Sell the GBP/USD pair and set a take-profit at 1.2300.
- Add a stop-loss at 1.2435.
Sterling continued tilting upwards on Monday morning as the US dollar index sell-off continued. The closely watched DXY index has plunged from last year’s high of $115 to about $122. GBP/USD, on the other hand, has soared from 1.0372 to 1.2450, which is a near 20% gain.
Risk-off sentiment
The GBP/USD had an eventful week as the UK published important economic numbers. On Tuesday, the agency said that the country’s labor market continued tightening in November. The unemployment rate remained at 3.5% while wages continued growing.
On Wednesday, the agency published the latest inflation numbers. The data revealed that the country’s inflation eased slightly in December. According to the ONS, the headline consumer price index declined from 10.7% in November to 10.5% in December.
And on Friday, like in the United States, data revealed that retail sales edged downward in December. Headline retail sales dropped by 1% as concerns about food prices continued. Therefore, these numbers mean that the Bank of England has a lot of work to do as it tries to engineer a soft landing. Further rate hikes could depress the economy.
Meanwhile, according to the Wall Street Journal (WSJ), the Federal Reserve is considering slowing the pace of rate hikes for the second straight month. Citing recent Fed officials, the bank will likely hike by 0.50% in its upcoming meeting.
There will be no economic data on Monday. Therefore, the focus will be the upcoming flash manufacturing and services PMI numbers set for Tuesday. These numbers will provide more information about the state of the economy.
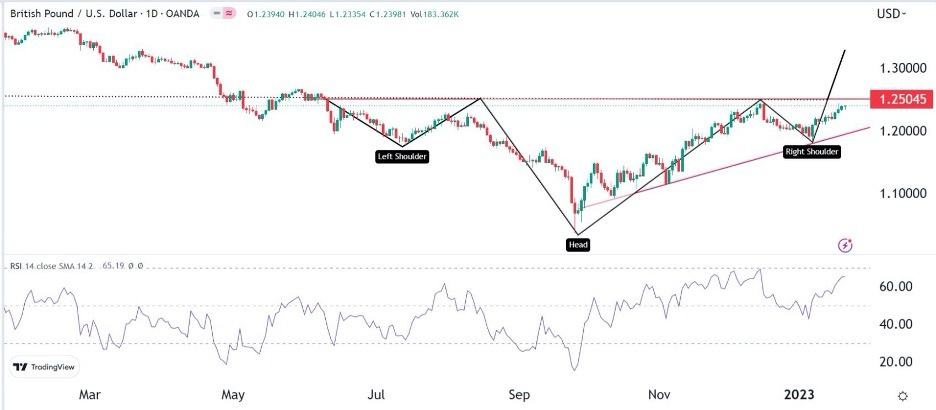
GBP/USD daily chart
The 1D chart shows that the GBP/USD price has formed several important patterns. It has formed an ascending triangle pattern that is shown in red. The pair have also created an inverted head and shoulders pattern. Also. it seems like it has formed a small double-top pattern.
Therefore, the key point to watch will be at 1.2500. A move above that point will invalidate the double-top pattern and mean that buyers have prevailed.

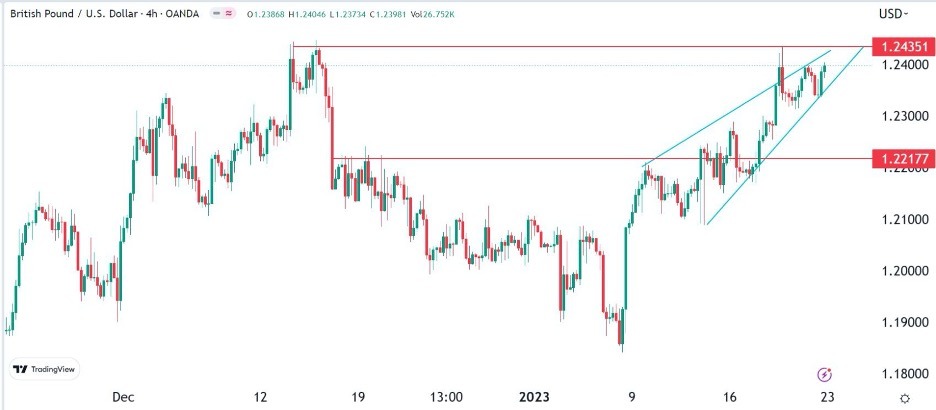
GBP/USD 4h chart
The 4H chart has also been rising in the past few days. Like on the daily chart, the pair has also formed a double-top pattern. Another emerging pattern is the rising wedge that is shown in green. There is also an inverted head and shoulders pattern. Therefore, the pair will likely remain in this range on Monday because of no major news. In the near term, it will likely have a brief pullback and then resume the bullish trend.

Ready to trade our free daily Forex trading signals? We’ve shortlisted the top UK forex trading platforms in the industry for you.
