Advertisement
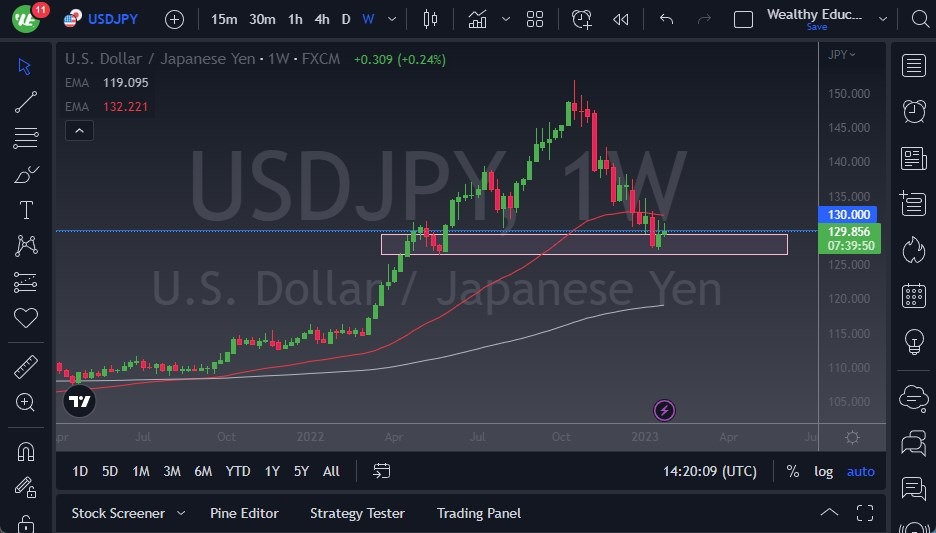
USD/JPY
The USD/JPY initially rallied a bit during the course of the week but did give back some of the gains. At this point, it looks as if this pair is at a major inflection point, and therefore I will be watching this chart quite closely. The Bank of Japan has reiterated his desire to keep the 10-year JGB down to 50 basis points, meaning it may have to print unlimited yen if rates start to rise around the world. Because of this, if the market were to break above the candlestick of the previous week, it’s very likely that the uptrend continues. Alternatively, if the market were to break down below the ¥127 level, there’s a huge air pocket underneath tickets in this market down quite rapidly.
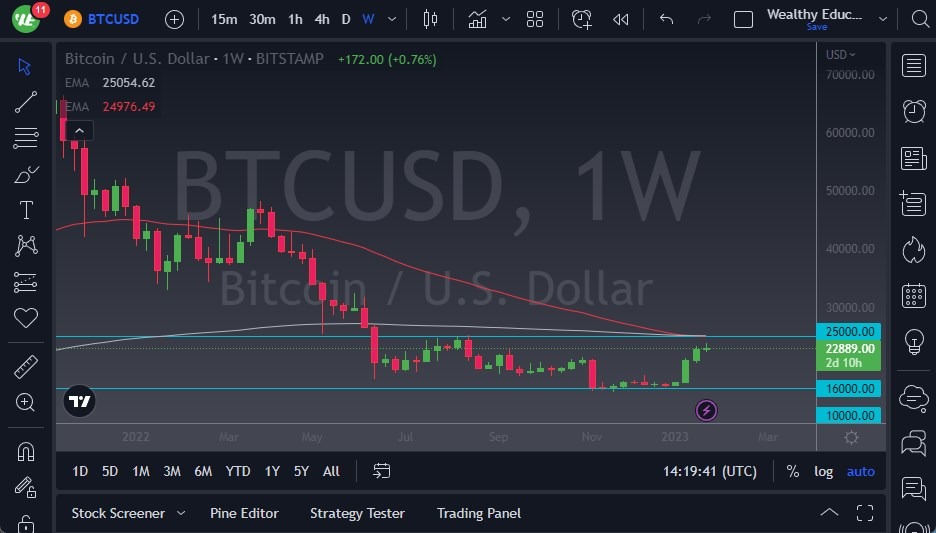
BTC/USD
Bitcoin initially shot a little bit to the upside but gave back quite a bit of its gains. It looks as if the market is starting to run out of momentum, and a pullback would not be very surprising. The 50-Week EMA is breaking below the 200-Week EMA, and it’s also worth pointing out that there is a Federal Reserve meeting this coming week that will reiterate a tight monetary policy. It’s very likely that Jerome Powell will do everything he can to make the market believe in the “tighter for longer” policy. That will more likely than not put downward pressure on Bitcoin.
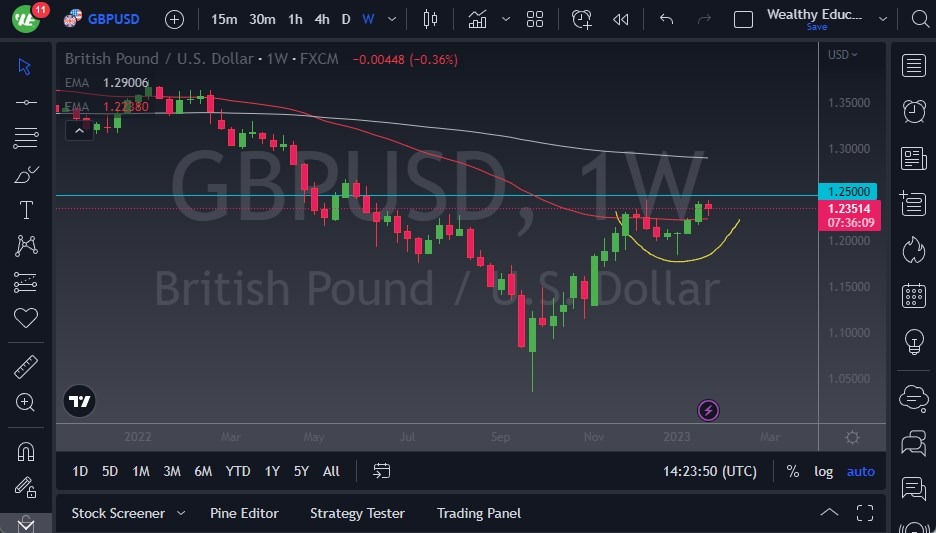
GBP/USD
The British pound has pulled back a bit during the course of the week, as we continue to see a lot of hesitation near the 1.25 level. If we can break above the 1.25 level, then we would challenge the 1.26 level. Anything above there will more likely than not send this market into a longer-term uptrend. However, it’s more likely than not that we will see a bit of sideways action in the short term, as we try to sort out what we’re going to do over the next several weeks.
AUD/USD
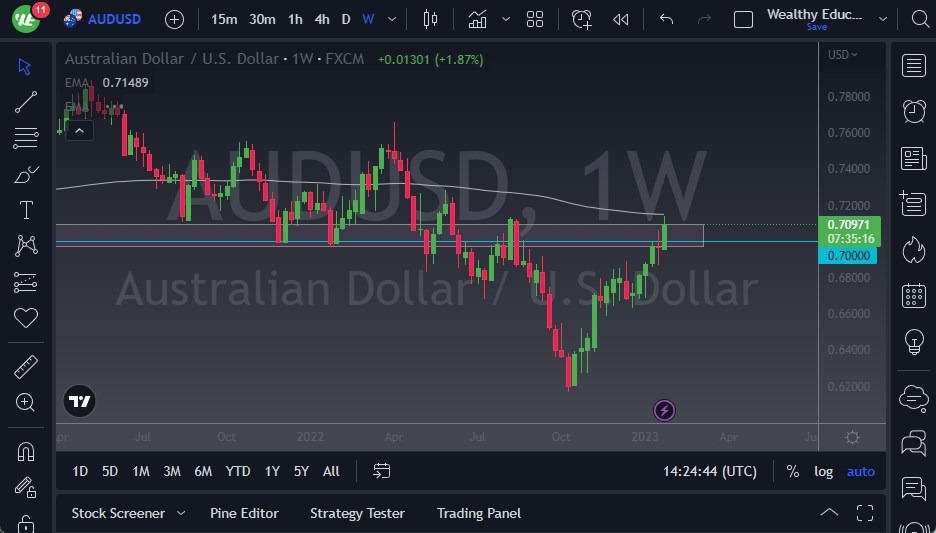
The Australian dollar has rallied rather significantly during the week as the inflation numbers out of Australia continue to look hot. The Reserve Bank of Australia now faces inflation that it may have to fight, so, therefore, traders are betting on a more hawkish attitude. The 200-Week EMA has offered resistance, but if we can break above it, then I think it’s likely that this market goes higher, perhaps reaching the 0.73 level. On the other hand, if we were to break down below the 0.70 level, then it’s likely that we could go looking to the 0.69 level.
AUD/JPY
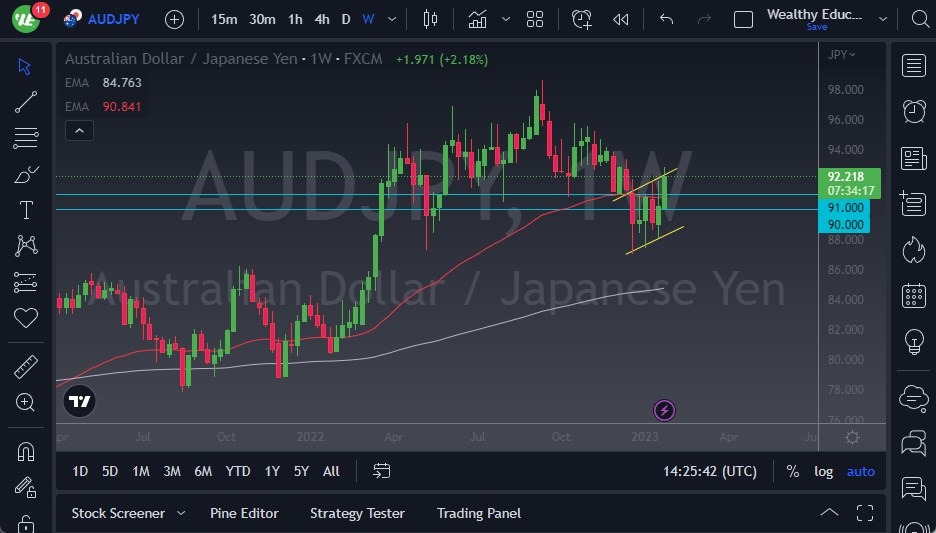
The Australian dollar has rallied against the Japanese yen as well and is leading the fight against Japanese strength. However, we are still very much in a channel, so I need to see this market break above the top of this past week to go bullish and start looking to the ¥95 level. On the other hand, if we do pullback, I do think that there are plenty of buyers underneath it will lease keep this pair stable.
USD/CAD
The US dollar has given back gains against the Canadian dollar during this past week, and now it looks like we are going to test the 1.33 level. That being said, we are also approaching an area that has been supported previously, so if we were to break above the top of this past week, then I think we could see a move toward the 1.36 level. Ultimately, this is probably going to come down to crude oil, which looks as if it’s trying to go bullish, and if it does it’s possible that the Canadian dollar may pick up a bit of strength. However, oil starts to fall, then it’s likely that this pair goes higher, especially if the US dollar shows strength against almost everything else.

EUR/USD
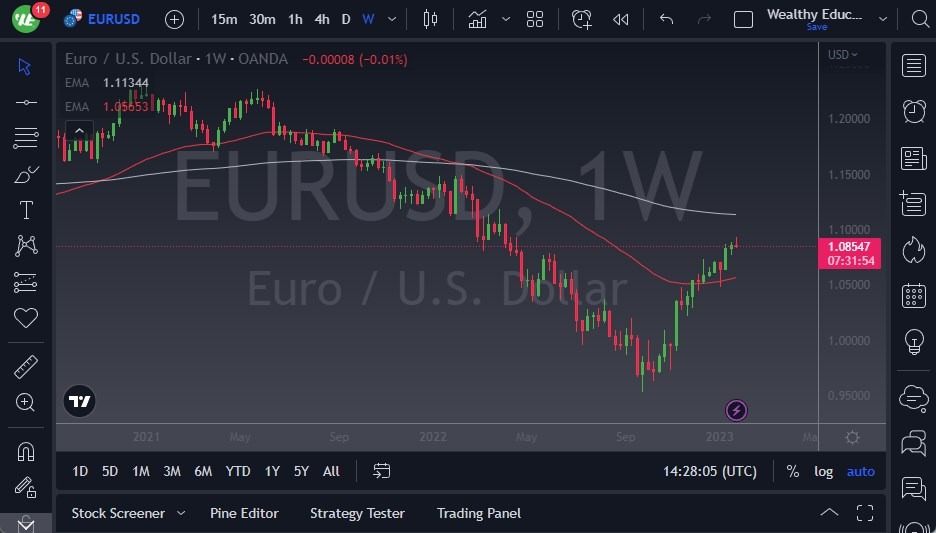
The Euro initially tried to rally during the course of the trading week but gave back gains as it could not hang on to the bullish pressure. Alternatively, we ended up forming a bit of a shooting star, so I think we were broken down below the bottom of the candlestick, it’s likely that the 1.08 level gets targeted, then possibly the 1.06 level, which is also supported by the 50-Week EMA.
While the ECB is likely to remain hawkish for a couple of meetings, it’ll be interesting to see what Jerome Powell says Wednesday, because that will directly affect where the US dollar goes over the next several weeks, and this could cause a bit of a correction in this pair.
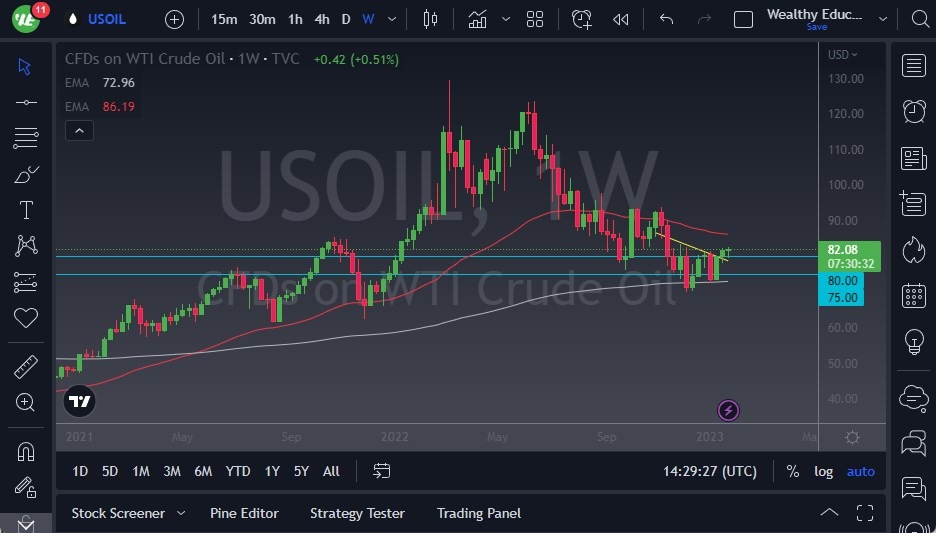
WTI Crude Oil
The West Texas Intermediate Crude Oil market initially dipped during the week but does look resilient at this point. If the market were to break above the $82.50 level, it’s possible that could get looking to reach the 50-Week EMA, which is right around the $88 level. For what it is worth, you should keep in mind that the 200-Day EMA sits right around in the same area on the daily chart, so it makes a nice target. However, if we break down below the bottom of the candlestick from the previous week, there’s not much standing in the way of falling back to the 200-Week EMA.
