Bearish view
Bullish view
- Set a buy-stop at 23,400 and a take-profit at 24,500.
- Add a stop-loss at 22,500.
Bitcoin and other risky assets like stocks pulled back modestly after the strong American non-farm payrolls (NFP) data. The BTC/USD price dropped to 23,000, which was a few points below last week’s high of 24,234. Similarly, the risky tech-heavy Nasdaq 100 index retreated by over 1.5%.
Bitcoin rally runs out of steam
The BTC/USD price declined sharply as the US dollar index rose sharply following the latest American jobs numbers. These numbers caught many analysts by surprise as they revealed that the unemployment rate dropped to 3.4% as the economy added over 517k jobs in January.
As such, these numbers seem to support the Fed’s view that interest rates will remain higher for longer than expected. This explains why the US dollar index (DXY) rose by more than 1.2% to $102.8. In most cases, the US dollar has an inverse correlation with Bitcoin.
Last week, the Fed made its interest rate decision, in which it decided to hike by just 0.25%. It had hiked by 0.50% in December and by 0.75% in the past four straight meetings. Therefore, expectations are that the bank will pause hiking in May.
BTC/USD forecast 4H analysis
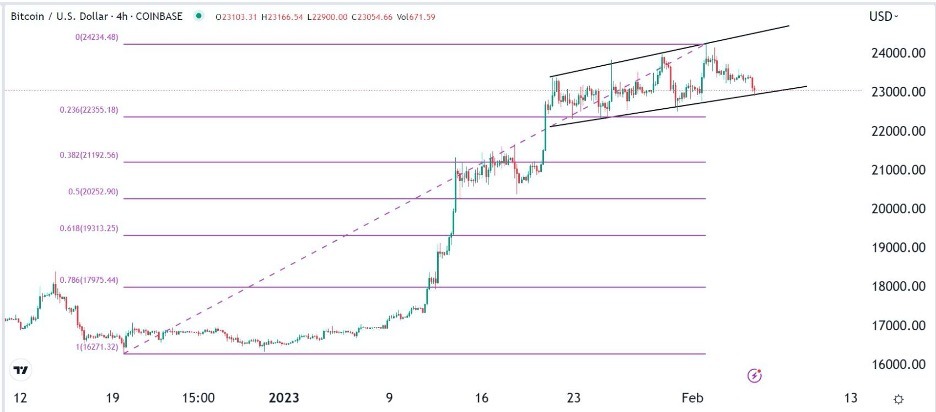
On the 4H chart, we see that the BTC/USD pair has lost the momentum it had in the first weeks of the month. It has remained in a consolidation phase between 22,350 and 24,269. Along the way, the pair has formed an ascending channel and is now slightly above its lower side. The pair has moved slightly above the 23.6% Fibonacci Retracement level.
Also, it has formed a triple-top pattern. Therefore, the bias for the BTC/USD pair is bearish, with the next key point to watch being at 22,340, the 23.6% retracement point. The stop-loss of this trade is at 23,400.

Bitcoin daily chart analysis
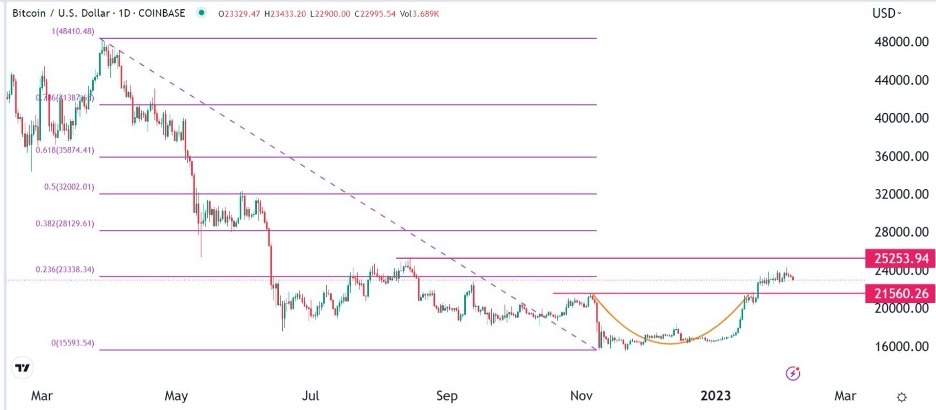
The daily chart presents a clearer picture of what is happening. The BTC/USD pair moved slightly above the key resistance at 21,560 (November 5 high). It has also faced some resistance at the 23.6% retracement point. Also, it has formed what looks like a cup and handle pattern. Therefore, the pair will likely retest the support at 21,560 and then resume the bullish trend and retest the key resistance point at 25,253 (August 15 high).
Ready to trade our daily Forex signals? Here’s a list of some of the best Forex brokers to check out.
