Bearish view
- Sell the GBP/USD pair and set a take-profit at 1.1845.
- Add a stop-loss at 1.2155.
- Timeline: 1-2 days.
Bullish view
- Set a buy-stop at 1.2125 and a take-profit at 1.2225.
- Add a stop-loss at 1.2050.
The GBP/USD exchange rate drifted lower on Monday ahead of a busy week in the financial market. It pulled back to an intraday low of 1.2045, which was a few points below last week’s high of 1.2196. It has been in a downward trend amid a resurgent US dollar.
UK and US inflation data ahead
The GBP/USD price is set to be more volatile this week as statistics agencies in the US and UK deliver January’s inflation and retail sales data. Inflation numbers from the US will come on Tuesday and will set the tone of what to expect from the Fed.
Economists polled by Reuters expect the numbers to reveal that inflation remained stubbornly high in January. Precisely, they expect that the headline inflation figure rose from 0.1% in December to 0.4% in January. On a YoY basis, they expect that inflation pulled back from 6.5% to 6.2%.
These numbers are closely watched because they will have an impact on the next actions of the Federal Reserve. If inflation comes in stronger than expected, the bank will likely maintain its hawkish tone and continue hiking rates.
The other important catalyst for the GBP/USD pair will be the UK. The Office of National Statistics (ONS) will publish the latest jobs numbers from the country. Economists expect that UK’s unemployment rate remained at 3.7% in December as average earnings rose by 6.5%.
The agency will then publish January’s inflation data on Wednesday. Economists expect that the headline consumer price index (CPI) dropped by 0.4% in January. They also expect it to have risen by 10.2% on a year-on-year basis. Core inflation is expected to have dropped by 0.5% leading to a YoY increase of 6.2%.
GBP/USD prediction
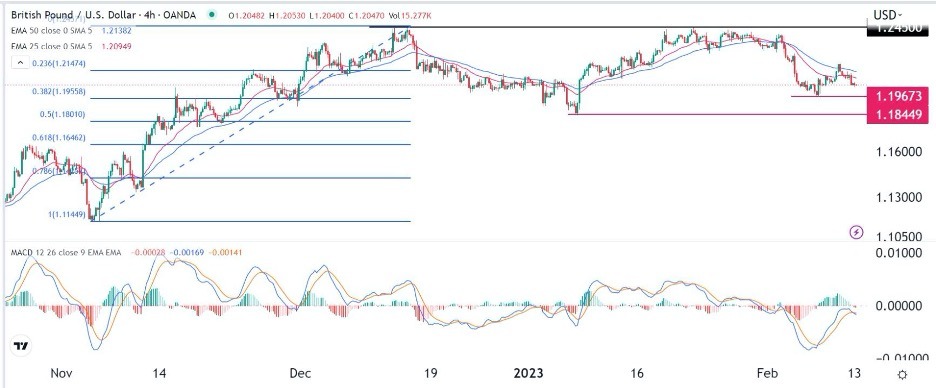
The GBP/USD pair continued pulling back because of the strong US dollar. On the 4H chart, the pair moved below the 23.6% Fibonacci Retracement level. It moved below the 50-period moving average. The price is a few points above 1.1967, the lowest point on February 7. Oscillators like MACD and the Relative Strength Index (RSI) have continued pulling back.
Therefore, the pair will likely continue falling, with the next key support level being at 1.1845, which is about 1.65% below the current level. This price is also a few points above the 50% Fibonacci Retracement level.
Ready to trade our Forex daily analysis and predictions? Here are the best Forex brokers in the UK to choose from.
