Bearish view
- Sell the AUD/USD pair and set a take-profit at 0.6500.
- Add a stop-loss at 0.6800.
- Timeline: 1-2 days.
Bullish view
- Set a buy-stop at 0.6700 and a take-profit at 0.6800.
- Add a stop-loss at 0.6600.
The Australian dollar (AUD/USD) dropped to its lowest level since March 16 ahead of the upcoming US consumer confidence data. It has dropped by 0.655 from the highest level this month. In all, the Aussie has fallen by ~7% from the year-to-date high.
The main data to watch on Tuesday will be the latest consumer confidence numbers. These are important numbers because of the important role that consumer spending plays in the economy. It is the biggest part of the economy.
Therefore, strong confidence data send signs that Americans are more confident about the economy, which will lead to more spending. The figure will be important because it comes a few days after the Fed delivered the latest interest rate decision. In it, the bank hiked interest rates by 0.25% and pointed to more increases.
AUD/USD technical analysis (4H chart)
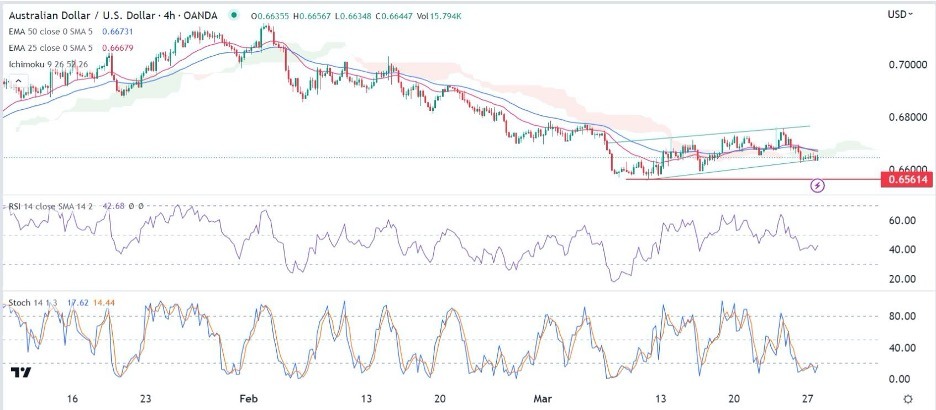
The AUD/USD pair pulled back on Monday and Tuesday morning after the latest Australian inflation numbers. It moved to the lower side of the ascending channel shown in green. The pair has moved below the 25-period moving average while the Relative Strength Index (RSI) has moved below the neutral point of 50.
The AUD/USD pair moved below the Ichimoku cloud. At the same time, the Relative Strength Index (RSI) has moved from the near-overbought level of 63.62 to a low of 44. At the same time, the Stochastic Oscillator has moved to the oversold level.
Therefore, there is a likelihood that the pair will have a bearish breakout as sellers target the next key support point at 0.6561, the lowest point on March 10. The stop-loss of this view will be at 0.6700.

AUD/USD chart analysis (daily chart)
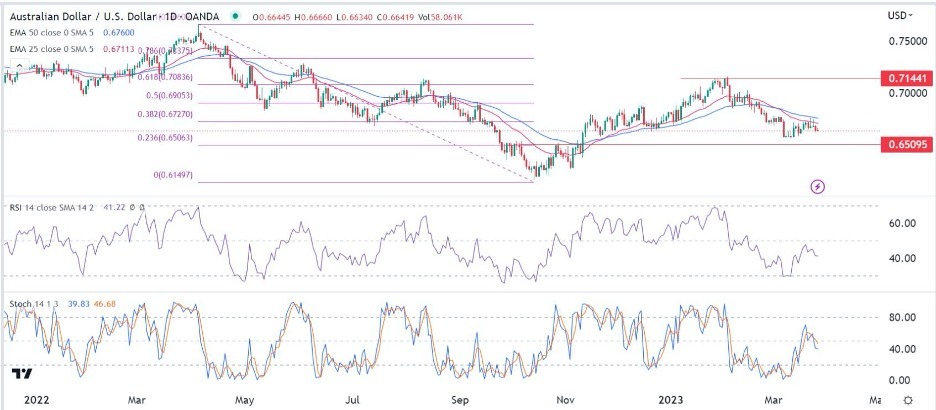
The daily chart shows that the Australian dollar has been in a strong downward trend after peaking at 0.7144 on February 1. The 25-day and 50-day exponential moving averages have made a bearish crossover pattern, which is a bearish sign. Further, the RSI and the Stochastic Oscillator have all tilted downwards.
The pair has moved to the 38.2% Fibonacci Retracement level. Therefore, even on the daily chart, the outlook of the pair is bearish. A move below this month’s low of 0.6568 will signal that bears have prevailed. If this happens, the next key level to watch will be at 0.6500.
Ready to trade our daily Forex signals? Here’s our selection of the best Australian Forex brokers worth your consideration.
