Bullish view
- Set a buy-stop at 24,700 and a take-profit at 26,548.
- Add a stop-loss at 23,500.
- Timeline: 1 day.
Bearish view
- Set a sell-stop at 23,000 and a take-profit at 22,000.
- Add a stop-loss at 24,500.
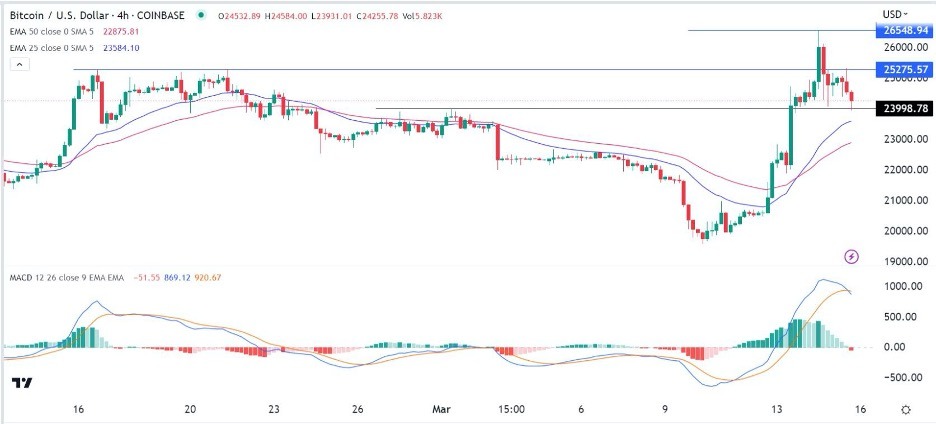
The BTC/USD price pulled back sharply after it rose to a multi-month high of 26,548 on Tuesday. It retreated to a low of 23,990 as fears of contagion spread across all sectors of the market. Bitcoin remains comfortably higher than last week’s low of $19,596.
Bond and stocks plunge
Bitcoin’s meltdown coincided with the overall crash of other financial assets. In Europe, stock market indices like the German DAX, France's CAC 40, and UK’s FTSE 100 dropped by more than 3%. Similarly, in the United States, all major indices like the Dow Jones and Nasdaq 100 fell by over 1%. In Asia, key indices like the Hang Seng and Nikkei 225 dropped hard on Thursday morning.
The same price action happened in the bond market. Bond prices in the US and Europe jumped, pushing their yields to the lowest point in months. The 2-year bond, which was yielding about 5% last week, has now moved to about 3.7%. Similarly, the 30-year and 10-year yields have dropped while the yield curve has risen to the highest level in months.
This price action is mostly because of the banking sector. In the past few days, we have seen the collapse of key banks like Silicon Valley Bank and Signature Bank. And now, there are serious concerns that Credit Suisse, the second-biggest bank in Switzerland is on the verge. The firm’s stock has cratered by over 90% in the past few years.
Therefore, the BTC/USD price dropped because of its close correlation with stocks. Also, it fell because of the strength of the US dollar in times of a major financial crisis. The closely watched dollar index rose by more than 1.2% to $104.47. In most periods, Bitcoin tends to move in the opposite direction from the US dollar.
BTC/USD technical analysis
The BTC/USD pair pulled back after rising to the highest point since October last year. On the 4H chart, Bitcoin dropped below the key support at 25,275, the highest point in February. It remains slightly above all moving averages. Also, it has formed what looks like a small head and shoulders pattern while the MACD and the signal line have made a bearish crossover pattern.
Therefore, the pair will likely be a bit volatile on Thursday. This could see it attract investors who are buying the dip. As such, if this happens, the pair will likely have a bullish breakout as buyers target the key resistance at $26,000.
Ready to trade our daily Bitcoin crypto signals? Here’s a list of some of the best cryptocurrency brokers to check out.
