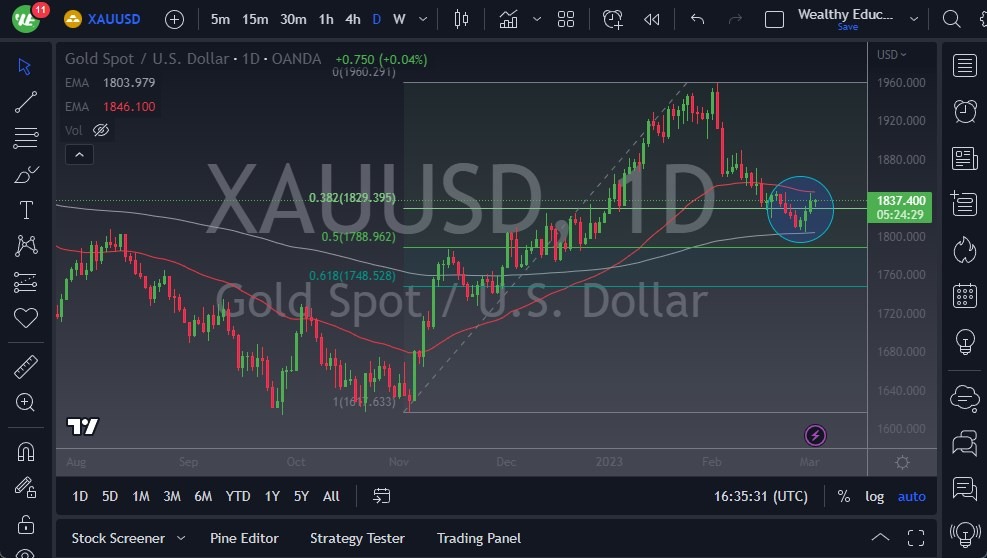
- On Thursday, the gold market experienced some pullback but soon recovered and showed signs of life.
- The market seems to be attempting to reach the 50-Day EMA, which is currently at $1854 and the futures contract.
- However, this area is expected to offer significant resistance in the short term, leading to a lot of noisy trading. Breaking above the 50-Day EMA could lead to a surge in the market, with gold possibly reaching the $1900 level, which has been a significant resistance point in the past.
One factor that should be noted when considering the $1900 level is the presence of many inverted hammer candlesticks. This is generally considered a negative situation, but it is important to assess whether the market can break above this area. Just above the $1900 level, there are a couple of massive red candlesticks, indicating that there is a lot of selling pressure in that region. Therefore, for gold to make a longer-term move, the US dollar may need to weaken and interest rates may need to drop.
The Short-term Outlook Remains Uncertain
At present, gold is positioned between the 50-Day EMA and the 200-Day EMA, and it is expected that the market will continue to exhibit noisy behavior. This situation highlights the importance of assessing the market through the lens of volatility and inflection points. Eventually, a large candlestick is likely to emerge, and breaking out of the current range could lead to a significant move of about $50. Consequently, it is essential to pay attention to the daily close above or below these moving averages to take advantage of potential opportunities.
While the gold market has shown some signs of life, the short-term outlook remains uncertain. The 50-Day EMA and $1900 level offer significant resistance, and the market may continue to exhibit noisy behavior in the coming days. However, by carefully monitoring the market and assessing inflection points, it may be possible to take advantage of potential opportunities for upward momentum. Either way, you are going to need to be very cautious with the position size in this area, but it is definitely worth paying close attention to the fact that we bounce from the 200-Day EMA, which is a classic technical analysis support signal. If we were to break down below that level, then there is a gap in the futures markets that focuses on 1775 that could be targeted.
 Ready to trade our Gold forecast? We’ve shortlisted the best Gold brokers in the industry for you.
