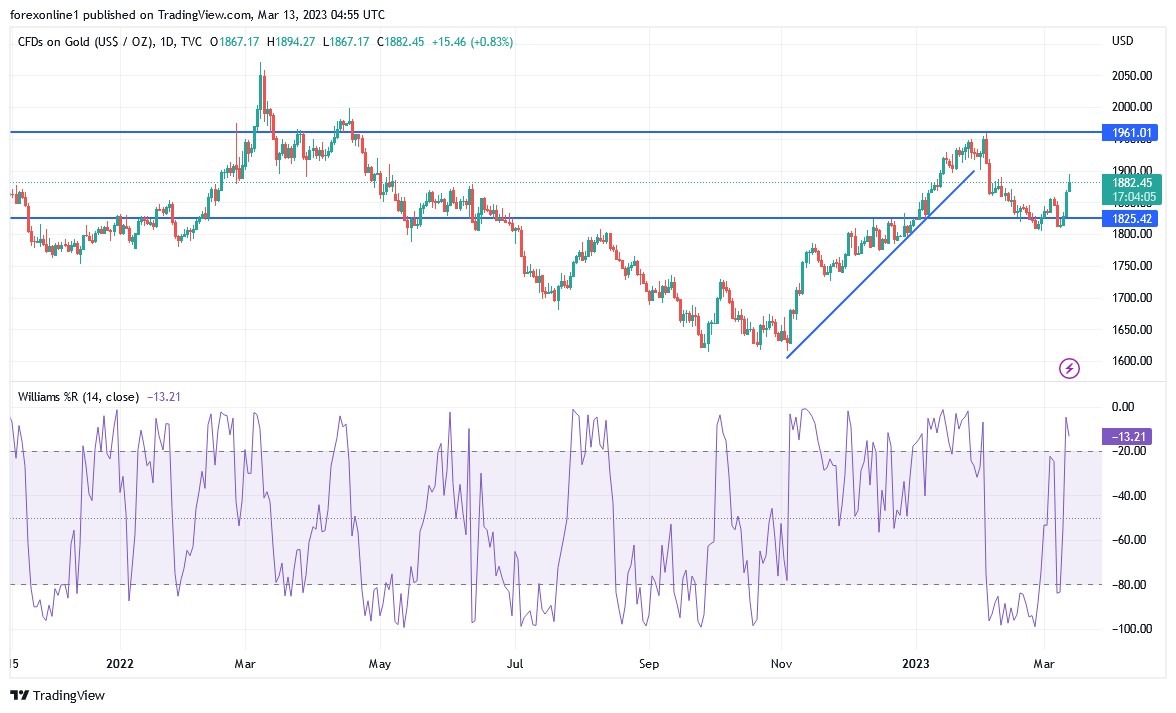
The XAU/USD gold price extended its gains in Friday's trading session to a new monthly high at around $1870 an ounce, after the last round of US data, and closed last week's trading close to its gains. The yellow metal is trading affected by the results of the US economic data, as the US non-farm payrolls for February exceeded expectations of 205 thousand with the number of jobs 311 thousand.
On the other hand, the US unemployment rate for the month rose by 2 percentage points to 3.6% from 3.4% in January, missing the consensus estimate of 3.4%. Elsewhere, the labor force participation rate rose to 62.5%, up from 62.4%, beating market estimates of 62.3%, while average hourly growth for the month missed the expected (annualized) 4.7% change with a change of 4.6%.
The equivalent (MoM) was also down 0.3% with a change of 0.2%. Prior to that, US Initial Jobless Claims for the week ending February 3rd missed the expected claims count of 195K by a count of 211K. On the other hand, the change in US employment (ADP) for February exceeded the expected number of jobs at 200 thousand, with a count of 242 thousand, while the trade balance of goods and services exceeded the expected figure at -68.9 billion dollars, with a reading of -68.3 billion dollars.
All in all, a year after the Federal Reserve began its most aggressive rate hike cycle in decades, the US stock market is at a pivotal point, as nervous investors need to calm down more than ever.
The Standard & Poor's 500 index fell more than 4% last week, the most since September, after the collapse of high-profile Silicon Valley lender SVB Financial Group raised fears of additional risks hiding on other banks' balance sheets. Meanwhile, questions swirl over the Fed's policy path as the US central bank enters a lull ahead of its interest rate decision on March 22.
With the silence of Federal Reserve officials, eyes turn to the release of the US consumer price index next Tuesday, after US jobs data last week indicated that inflation may decline. It sets the stage for a fully-fledged extension of stocks ahead of the US central bank's announcement and subsequent discussion by Chairman Jerome Powell of the path forward.
The CPI report is expected to provide further evidence of easing inflation pressures, as forecasts call for annual growth of 6% in February, down from 6.4% in January. It could boost resurgent bets in the swaps market that the Fed will end its tightening campaign around the middle of the year and cut interest rates by the end of the year, laying the groundwork for a stock recovery in the second half of 2023.
Technical analysis of gold prices:
- It appears that the XAU/USD gold price is trading within a sharply ascending channel formation.
- This indicates a strong short-term bullish bias in market sentiment.
- Therefore, the bulls will be looking to ride the current rally towards $1872 an ounce or higher to $1880 an ounce.
- On the other hand, the bears will target potential pullback profits around $1855 or lower at $1846 an ounce.
On the long term, and according to the performance on the daily chart, it appears that the yellow metal price, XAU/USD, has recently completed an upward breach from the descending channel formation. This indicates a significant swing in market sentiment from bearish to bullish. Therefore, the bulls will target the extended rebound profit at around $1,889 or higher at $1,918 an ounce. On the other hand, bears will target long-term profits at around $1839 or lower at $1811 an ounce.
Ready to trade today’s Gold prediction? Here’s a list of some of the best XAU/USD brokers to check out.

