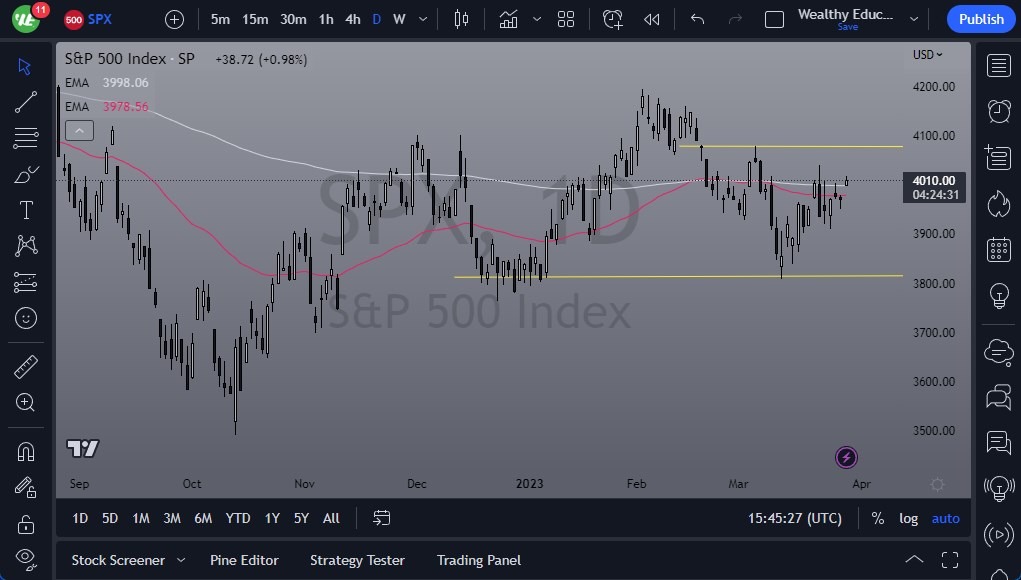
- The S&P 500 index has seen a rally during Wednesday's trading session, with the market approaching the crucial 4050 level.
- If this level is surpassed, the next area to watch is 4100, which has served as both resistance and support in the past.
- However, it remains to be seen whether the market will be able to break above this level, as it has faced significant resistance in the past.
Although Wall Street seems optimistic about potential interest rate cuts, the Federal Reserve has been clear that it is not going to happen, so the market may be sitting just below a major resistance area that could trigger some selling pressure. At the first signs of exhaustion, traders may be willing to start shorting the market. However, it's unlikely that the S&P 500 will experience a significant breakdown, as the 200-Day EMA sits underneath, and the 50-Day EMA is just below that.
If the market does break down, the candlestick from Tuesday's session marks the next area of support, followed by the 3950 and 3900 levels. Currently, the market seems to be bouncing between the 3900 level and the 4100 level, and if it breaks above 4100, the next target could be 4200. However, traders should expect to see a lot of volatility and noise in the market and should be cautious with their position sizing. This is especially true as we are heading toward the end of the month, as there is a certain amount of “window dressing” that will be done by large money managers, and therefore it’s very likely that the next couple of days could be noisy.
Traders Should Remain Vigilant
With the upcoming blackout period for companies not being able to buy back shares, and another earnings season expected to be challenging, traders should remain vigilant and not be swayed by Wall Street narratives aimed at selling stocks to retail traders. Overall, the market seems to be in a state of uncertainty, and traders should keep an eye on resistance and support levels, as well as key moving averages, to identify potential trading opportunities.
As a signal: I am looking to sell the S&P 500 if there are any signs of weakness near the 4033 level on the one-hour chart. I will put a stop loss at the 4080 level, with a target of 3940. Position sizing will be smaller than usual as the noise continues to be overwhelming at times.

Ready to trade our S&P 500 daily forecast? Here are the best CFD brokers to choose from.
