Bearish view
- Sell the BTC/USD pair and set a take-profit at 26,000.
- Add a stop-loss at 29,000.
- Timeline: 1-2 days.
Bullish view
- Set a buy-stop at 27,880 and a take-profit at 30,000.
- Add a stop-loss at 26,000.
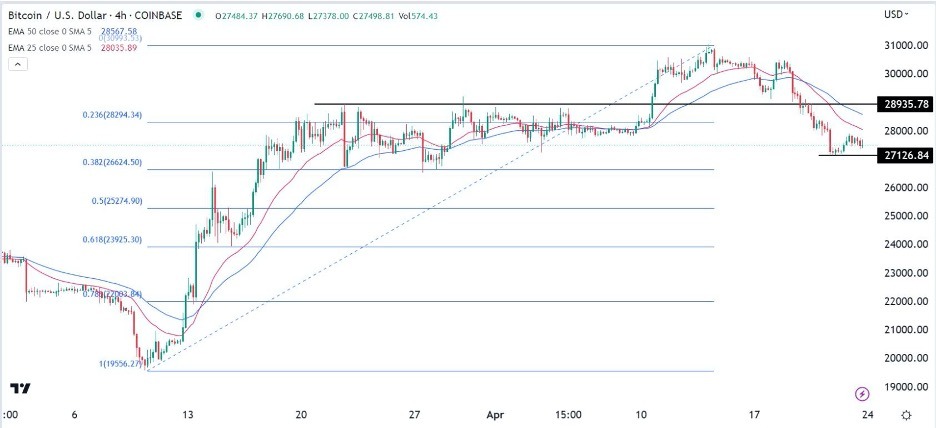
The BTC/USD pair has been under pressure in the past few weeks as the recent rally faded. Bitcoin dropped to a low of $27,126 during tbe weekend, the lowest level since April 3. In all, the coin has erased about 11.27% from its highest point this month, meaning that it has moved to a correction.
Bullish momentum fades
The recent Bitcoin sell-off has coincided with a period when the US dollar index (DXY) has moved up slightly in the past few days. After falling to a low of $100, the US dollar index has staged a slow comeback to trade at $101.80. Bitcoin tends to have a close correlation with the US dollar.
Bitcoin has also declined after it crossed the important resistance at $30,000. In most cases, Bitcoin and other assets tend to waver after reaching an important resistance point. Most recently, Bitcoin consolidated for months after it jumped to the resistance at $25,000. At some point, it also dropped below $19,000.
Therefore, there is a likelihood that this sell-off will be temporary. Analysts cite the upcoming Bitcoin halving as a likely catalyst. In most periods, Bitcoin tends to rally towards halving, which is a process that takes place every four years. It reduces the amount of Bitcoin rewards paid to miners, which makes mining less profitable. In a note, an analyst told Bloomberg that:
“Bitcoin cycles bottom around 12-18 months prior to the halving and this cycle structure looks similar to the past ones, albeit many things have changed — while the network is vastly stronger, Bitcoin has never endured a prolonged severe economic contraction.”
The key events that will move the BTC/USD pair will be earnings from the biggest technology companies and the upcoming US consumer confidence data.
BTC/USD technical analysis
The BTC/USD pair has been in a strong bearish trend in the past few days. Along the way, it has moved below the 23.6% Fibonacci Retracement level. It is now slightly above the 38.2% retracement point. At the same time, it has dropped below the 25-period and 50-period moving averages. The two averages have made a bearish crossover.
The pair has also moved below the important resistance point at 28,935, where it struggled to move above between March and early April. Therefore, more upside will be confirmed if the pair manages to move below the key support level at 27,126. A move below that level will invalidate the small double-bottom pattern that is forming.
Ready to trade our daily Bitcoin crypto signals? Here’s our list of the best Bitcoin brokers worth looking at.
