Bearish view
- Sell the EUR/USD pair and set a take-profit at 1.0788.
- Add a stop-loss at 1.0965.
- Timeline: 1 day.
Bullish view
- Set a buy-stop at 1.0945 and a take-profit at 1.1000.
- Add a stop-loss at 1.0850.
The EUR/USD price rebounded on Tuesday as traders waited for the upcoming US inflation data and Federal Reserve minutes. It rose to a high of 1.0925, the highest point since Monday. The euro has jumped by more than 10% from its lowest level in 2022 when it moved to below parity.
US inflation data ahead
The EUR/USD pair rose after the IMF published its growth forecasts for the European economy. In a report, the agency said it expects the bloc’s economy to expand by about 0.8% this year. That was an improvement from the previous estimate of 0.7%.
The European economy has started the year well as it managed to avoid the energy crisis that most analysts were expecting. Energy prices in the region have dropped, helped by higher shipments of liquified natural gas.
The report noted that Germany will have a mild recession while France and Spain will expand by 0.7% and 1.5%. Most analysts expect that Germany will also dodge a recession, helped by the resurgent industrial sector.
Meanwhile, the IMF downgraded the American economy, citing the ongoing banking crisis. It expects that the American economy will expand by 1.6% this year. The banking sector crisis will hit growth because banks will be a bit selective in lending.
The next key data to watch will be the upcoming US inflation data. Economists expect that the headline inflation dropped to 5.6% while core CPI rose to 5.9%. The headline CPI is expected to ease because of the energy sector. On Monday, data showed that online sales inflation dropped for the seventh straight month in March.
A strong consumer inflation data will push the Fed to continue hiking rates in the coming meetings. In a statement, Fed’s Patrick Harker said that the bank will increase by 0.25% in May and remain being data-dependent.
EUR/USD technical analysis
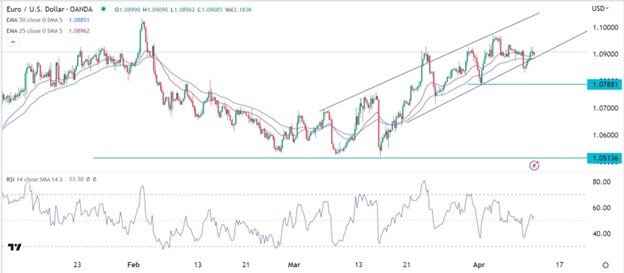
The EUR/USD pair made a bearish breakout on Monday and dropped below the lower side of the ascending channel. It then formed a doji pattern, whose lower side was 1.0831. In price action analysis, this pattern is usually a sign of reversal.
The pair also moved slightly above the 50-day moving average while the Relative Strength Index (RSI) remained at the neutral point of 50. The pair has also formed a small head and shoulders pattern. Therefore, the pair will likely resume the bearish trend after the US inflation data. If this happens, the pair will likely retest the support at 1.0788.
Ready to trade our free trading signals? We’ve made a list of the top 10 forex brokers in the world worth trading with.


