Bullish view
- Buy the GBP/USD pair and set a take-profit at 1.2665.
- Add a stop-loss at 1.2350.
- Timeline: 1-2 days.
Bearish view
- Set a sell-stop at 1.2350 and a take-profit at 1.2275.
- Add a stop-loss at 1.2450.
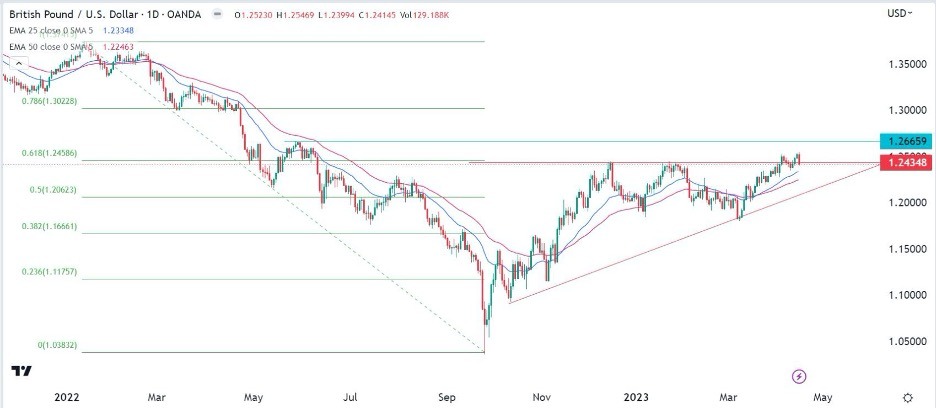
The GBP/USD exchange rate jumped to the highest point in over ten months as the US dollar sell-off intensified. The pair rose to a high of 1.2511, which was over 20% above the lowest point in 2022. Focus now shifts to important economic numbers from the UK that are scheduled for this week.
UK jobs, inflation, and retail sales
The GBP/USD pair jumped sharply last week after the US published key data and events. Inflation data published on Wednesday showed that the country’s headline consumer inflation continued dropping in March. It has now dropped in the past several straight months.
The pair also dropped after the Federal Reserve published its minutes on Wednesday. These minutes showed that some Fed officials supported pausing rates in the past meeting. They also warned about the state of the American economy as they signaled that a recession could happen this year.
Therefore, these events signaled that the Fed was nearing the end of its tightening cycle, which pushed traders to embrace a risk-on sentiment.
The GBP/USD pair also reacted to the first day of bank earnings season. On Friday, major banks like JP Morgan, Citigroup, and Wells Fargo announced that they had a great quarter as their revenue and profitability jumped. These banks benefited from higher interest rates and an influx of deposits after the collapse of Silicon Valley Bank and Signature Banks.
Other large banks like Bank of America, Goldman Sachs, and Morgan Stanley are expected to publish their financial results. Traders will focus on regional banks, which have been under intense pressure in the past few months.
The GBP/USD pair will also react to several important economic numbers from the UK. The Office of National Statistics (ONS) will publish the latest jobs numbers on Tuesday and inflation data on Wednesday.
GBP/USD technical analysis
The GBP/USD pair has been in a strong upward trend since September last year. As it rose, the pair formed an ascending triangle pattern that is shown in red. In price action analysis, this pattern is usually a bullish sign. It has also moved above the 25-day and 50-day moving averages. The pair has also risen above the 61.8% Fibonacci Retracement level.
Therefore, the pair will likely continue rising in the next few days as buyers target the key resistance point at 1.2665. The stop-loss of this trade will be at 1.2300.

Ready to trade our Forex daily analysis and predictions? Here are the best Forex brokers to choose from.
