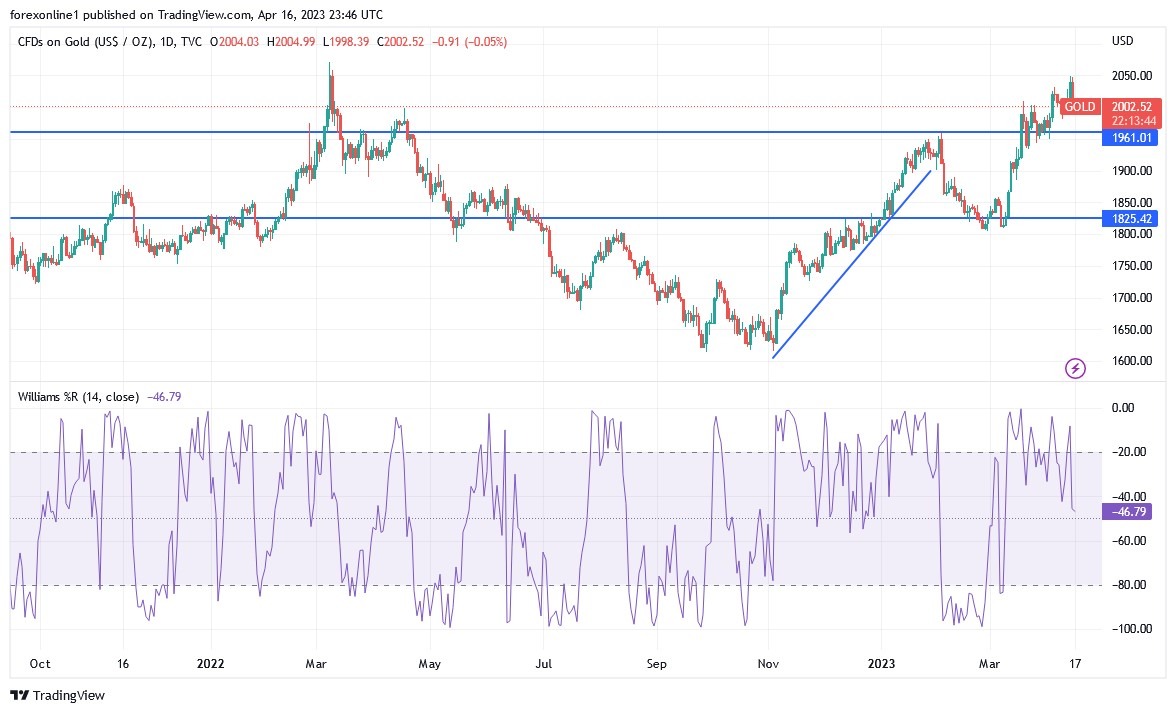
With the recovery of the US dollar at the end of last week's trading, the XAU/USD gold price was subjected to a downward correction. It reached the level of 1992 dollars an ounce, before closing trading around the level of 2004 dollars an ounce.
- In the same week, gold market gains reached the $2048 resistance level, the highest for the yellow metal in more than a year.
- It is also close to the price index of 2079 dollars an ounce.
- Its gains came primarily amid strong abandonment by investors of the US dollar, after cooling expectations about the future of raising US interest rates.
- This is in addition to the increasing global geopolitical tensions, which is a good environment for the rise in the price of gold and its recent gains.
Fundamental Analysis
The yellow metal is trading affected by the results of the latest economic data, as the US Retail Sales for March missed the expected change (MoM) of -0.4% with a change of -1%. The Retail Sales watch group also missed the expected change of -0.6% with a change of -0.3%, while US Retail Sales excluding automobiles missed the estimated change of -0.3% with a change of -0.8%. Michigan's preliminary US consumer confidence index for April beat the expected reading of 62 with a reading of 63.5. Import and export prices for the month of March exceeded both (monthly) and (annual) estimates.
In the same week, the US Producer Price Index for March also missed expectations. The previous Food and Energy PPI also missed the expected change (MoM) by 0.2% with a change of -0.1%, while the equivalent (YoY) is in line with the change of 3.4%. Elsewhere, the US CPI for the period missed estimates (monthly) and (yearly) at 0.3% and 5.2%, respectively, with readings of 0.1% and 5%. The previous CPI for Food and Energy matched both the (MoM) and (YoY) forecasts at 0.4% and 5.6%, respectively.
Overall, according to analysts, and even in the event of a global risk-off event, the US dollar's strength from safe-haven demand will be limited after the Fed made the central bank's permanent liquidity swap lines available daily in March, highlighting that the Fed is acting proactively. In dealing with the tight liquidity of the US dollar, which would limit any possible rise in the price of the dollar.
XAU/USD Technical Analysis:
In the near term and according to the performance on the hourly chart, it appears that the XAU/USD gold price is trading within a limited bearish channel formation. This indicates a strong short-term bearish bias in market sentiment. Therefore, the bears will be looking to extend the current range of declines towards $1992 or lower to $1979 an ounce. On the other hand, the bulls will look to pounce on profits at around $2022 or higher at $2038 an ounce.
On the long term, and according to the performance on the daily chart, it appears that the XAU/USD gold price is trading within a bullish channel formation. Technical indicators are still pointing higher and this indicates a significant bullish bias in the long-term market sentiment. Therefore, the bulls will look forward to a continuation of the current rise towards $2047 or higher to $2080 an ounce. On the other hand, the bears will look to pounce on pullbacks around $1970 or lower at $1934 an ounce.
Ready to trade today’s Gold forecast? Here are the best Gold brokers to choose from.

