The difference between success and failure in Forex / CFD trading is highly likely to depend mostly upon which assets you choose to trade each week and in which direction, and not on the exact methods you might use to determine trade entries and exits.
So, when starting the week, it is a good idea to look at the big picture of what is developing in the market as a whole, and how such developments and affected by macro fundamentals, technical factors, and market sentiment. There are some valid long-term trends in the market right now, which might be exploited profitably. Read on to get my weekly analysis below.
Fundamental Analysis & Market Sentiment
I wrote in my previous piece on 2nd April that the best trade opportunities for the week were likely to be:
- Long Bitcoin against the USD following a daily close above $30,000. This did not set up.
- Long of the GBP/USD currency pair following a daily close above $1.2437. This set up on Tuesday but ended the week lower with a loss of 0.71%.
- Long of the NASDAQ 100 Index. This produced a small loss of 0.89%.
News about global financial markets is dominated by speculation concerning the future of the US economy and interest rates based upon the latest key economic data releases. Some analysts see the chance of a recession emerging soon as growing following some worse than expected US jobs data last week, although Friday’s non-farm payrolls numbers slightly exceeded expectations. Bond markets are currently suggesting a 66% chance of another rate hike by the Federal Reserve at its next meeting in May, but it is widely felt that this will almost certainly be the last high in the current tightening cycle.
Another item that has been getting attention is OPEC’s recent production cut, which raised the price of Crude Oil over the past week.
Last week was relatively light in terms of data releases, and markets mostly traded with low volatility, and ended the week a day early due to the Easter holiday celebrated in many financial centers. However, the coming week will bring much more data, so we will probably see much more volatility when trading resumes.
Last week’s key data releases were:
- US Non-Farm Payrolls, Average Hourly Earnings, and Unemployment Rate – this was a little stronger than expected, with the unemployment rate unexpectedly falling to 3.5%.
- Australian Cash Rate and Rate Statement – the RBA passed on an expected rate hike of 0.25%, and the Australian Dollar then continued its decline.
- New Zealand Official Cash Rate and Rate Statement – the RBNZ hiked by 0.50% instead of the widely expected 0.25%, putting New Zealand’s interest rate at the highest of all major currencies.
- Swiss CPI data – this came in lower than expected, showing a month-on-month increase of only 0.2% compared to the 0.4% which had been expected.
- US JOLTS Job Openings data – this came in considerably lower than expected which some analysts see as evidence that the US economy is beginning a significant slowdown.
- US Unemployment Claims data
- US ISM Manufacturing PMI data
- US ISM Services PMI data
- Canadian Unemployment data
The Week Ahead: 10th – 14th April
The coming week in the markets is likely to see a higher, level of volatility compared to last week, due to a higher intensity of key data releases scheduled. This week’s key data releases are, in order of importance:
- US CPI (inflation) data
- US FOMC Meeting Minutes
- US PPI data
- Bank of Canada’s Overnight Rate, Rate Statement, and Monetary Policy Report
- UK GDP data
- US Retail Sales data
- US Unemployment Claims data
- Preliminary UoM Consumer Sentiment
- Australian Unemployment data
Monday will be a public holiday in New Zealand, Australia, the UK, Switzerland, Germany, France, and Italy.
Technical Analysis
US Dollar Index
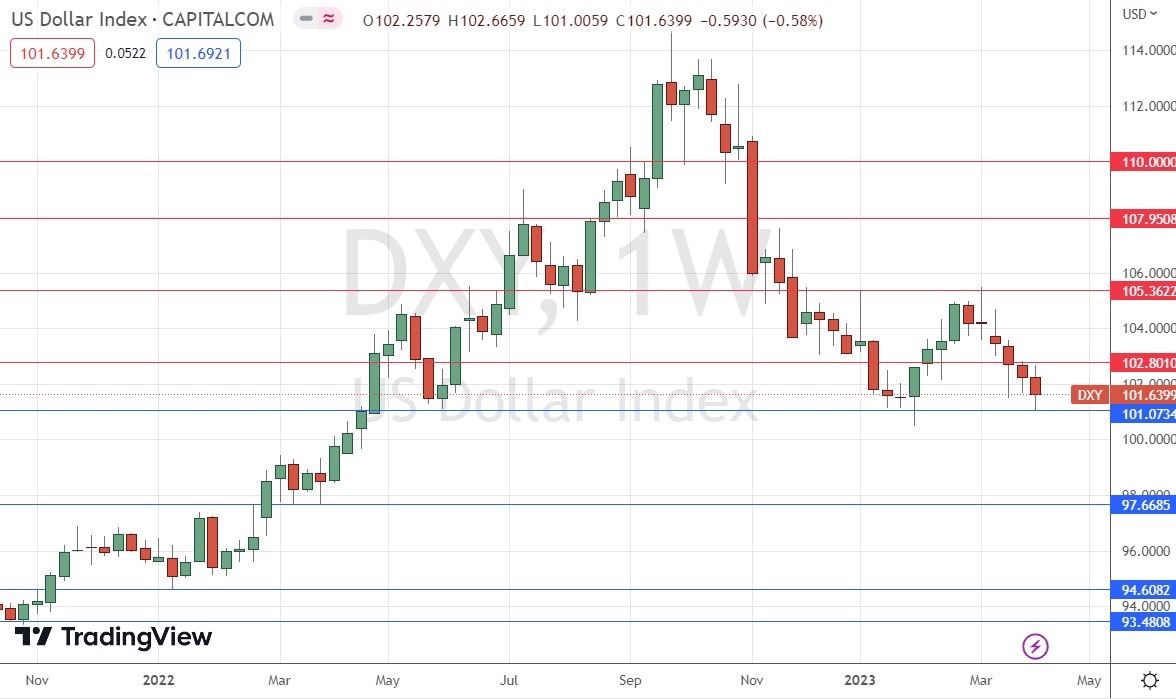
The weekly price chart below shows the U.S. Dollar Index again fell over the past week, but also rejected the key support level at 101.07 with a meaningful lower wick.
This suggests that we may be likely to see another fall over the coming week, which is reinforced by the long-term bearish trend in which the Dollar is trading below its levels of both 3 and 6 months ago.
The value of the Dollar is probably going to be strongly influenced by the US inflation data release due on Wednesday, regardless of technical considerations.

NASDAQ 100 Index
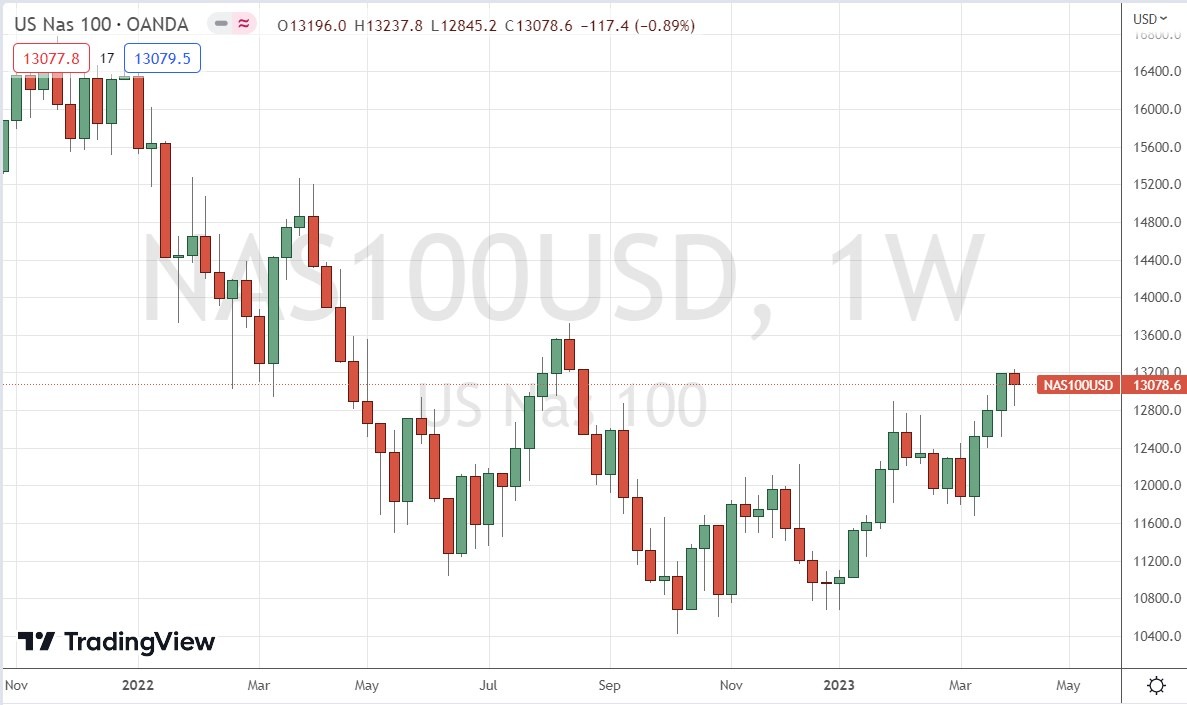
We saw a slight decline in the NASDAQ 100 Index over the week after last week’s close at a new 7-month high. However, in the context of the wider price action, the technical picture here remains bullish.
There are no key resistance levels until 13735, so the price has room to rise over the coming week.
The NASDAQ 100 Index still looks like a buy, but bulls should be warned some major industry players are talking down the recent tech rally, much will probably depend upon whether data due this Wednesday will continue to show US inflation data falling firmly.

Bitcoin
Last week saw the price of Bitcoin print another indecisive doji candlestick – yet it is still a bullish candlestick, even if a weak one.
The price is certainly in a bullish trend, having reached a new 9-month high price two weeks ago. The price was not able to make a new high last week, but it has held up and refused to decline. This, coupled with the bullish long-term trend, suggests it is worth remaining interested in Bitcoin.
Technically, the price chart below shows that the price still faces a cluster of three key resistance levels between the current price and the big round number at $30k. Traders might want to wait until we get a daily close above $30k and then go long, hoping for an explosive breakout. The price should then have room to rise to at least $33,400.
Alternatively, it is looking increasingly likely that the bears might win out and trigger a strong fall to at least $26,687.

GBP/USD
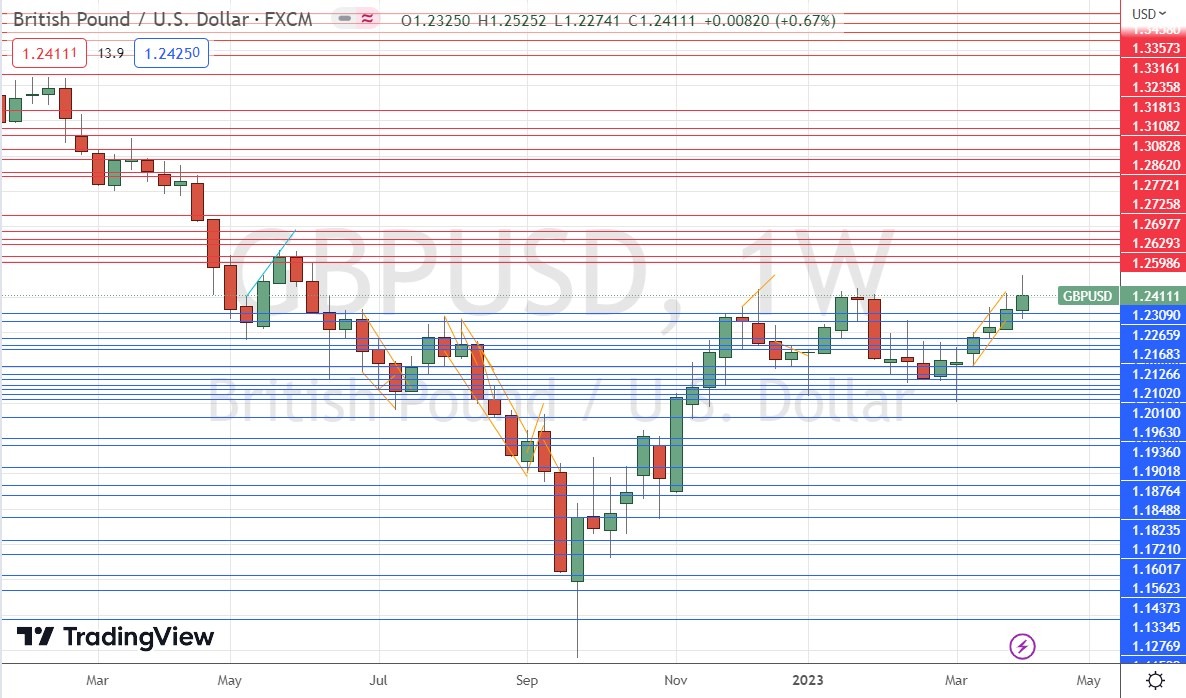
The GBP/USD currency pair rose for the sixth successive week, although the weekly candlestick shown within the price chart below exhibits a significant upper wick. It is important to note that this upper wick rejected a ten-month high price and the major round number at $1.2500. This is a very, very key resistance area.
There is no notable reason for the British Pound to be strong, beyond the improving economic forecasts made by the Bank of England and analysts – you can see several other currencies also enjoyed rises against the US Dollar over the past week.
I highlight this currency pair because it may already have made a major bullish breakout. If we get a daily close this week above $1.2500, I think it could make an excellent long trade entry, as there should be room to rise significantly.

Gold
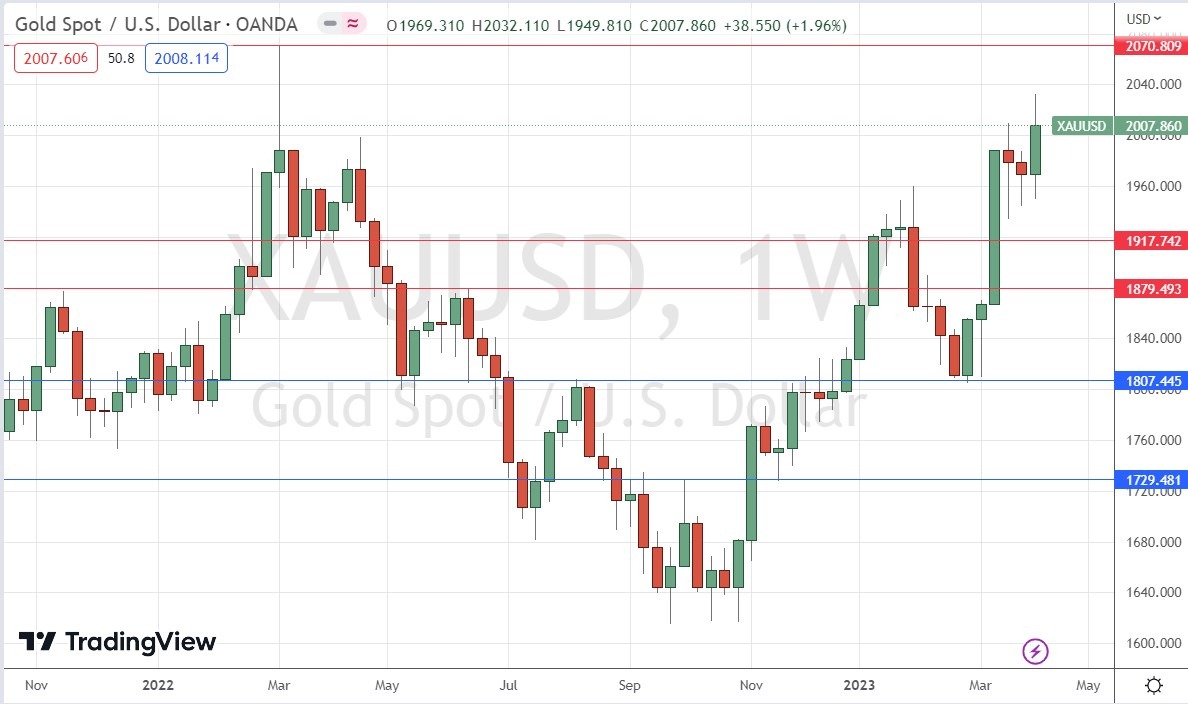
The price of Gold rose last week to close above the round number at $2000, making the highest weekly closing price in over two and a half years. Although the bullish weekly candlestick shown within the price chart below exhibits a significant upper wick, the fact that the price has held up above $2000 suggests that it has room to retest its all-time high at $2070, which is not far away.
I think Gold looks interesting on the long side, but as it is in a bearish retracement on shorter term timeframes, it may be best to drill down and wait for a bullish bounce once trading resumes this week before going long, ideally at $2000 or lower support levels below that.

Silver
The price of Silver rose strongly last week to close just below the round number at $25, making the highest weekly closing price in almost one year. Although the bullish weekly candlestick shown within the price chart below exhibits little upper wick, the fact that the overall technical picture looks less bullish than Gold should be a cause for some concern for bulls.
I think Silver looks interesting on the long side, but it faces strong resistance at $26.50 and has not yet convincingly cleared $25. The best approach may be to try to trade bullish breakouts above $25 on a shorter timeframe using tight stop losses, which may take a few attempts to get right.
Bottom Line
I see the best trading opportunities this week as:
- Long Bitcoin against the USD following a daily close above $30,000.
- Long of the GBP/USD currency pair following a daily close above $1.2500.
- Long of the NASDAQ 100 Index.
- Long of Gold following a bullish rejection of $2000, $1950, or $1917.
- Long of Silver following a convincing bullish breakout beyond $25.
Ready to trade our Forex weekly analysis? We’ve shortlisted the best Forex trading brokers in the industry for you.


