Bearish view
- Sell the BTC/USD pair and set a take-profit at 26,500.
- Add a stop-loss at 28,500.
- Timeline: 1 day.
Bullish view
- Set a buy-stop at 28,200 and a take-profit at 30,000.
- Add a stop-loss at 26,500.
The BTC/USD pair sell-off continued as concerns about Biitcoin’s high fees and slow speed continued. Bitcoin retreated to a low of 27,562, the lowest level since April 27. The pair has fallen by over 10% from the year-to-date high. Its alternatives like Bitcoin Cash, Bitcoin SV, and Litecoin jumped.
Bitcoin price daily chart analysis
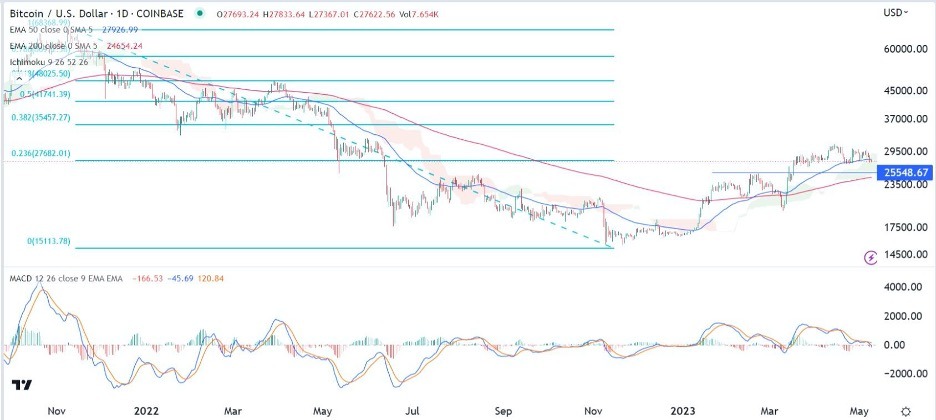
The BTC/USD pair has been in a slow bullish trend after it crashed to a low of 15,765 in November last year. Since then, it has jumped by more than 80%, making it one of the top-performing major assets since then. It has outperformed the Dow Jones, Nasdaq 100, and gold.
Bitcoin has also formed a golden cross pattern, which happens when the 200-day and 50-day exponential moving averages (EMA) make a bullish crossover. This crossover happened in February this year. The BTC/USD pair remains above the two moving averages to date.
Bitcoin has also moved to the 23.6% Fibonacci Retracement level. Further, it has moved inside the Ichimoku Kinko Hyo cloud. Therefore, the pair will likely continue retreating as sellers target the key support level at 25,548, which was the highest point in February.
In the long term, however, Bitcoin will likely continue rising as buyers target the 38.6% retracement point at 35,804. This view will be confirmed if the price moves above the year-to-date high of 31,000. A move below the support at 25,548 will signal that bears have prevailed.

BTC/USD analysis 4h chart
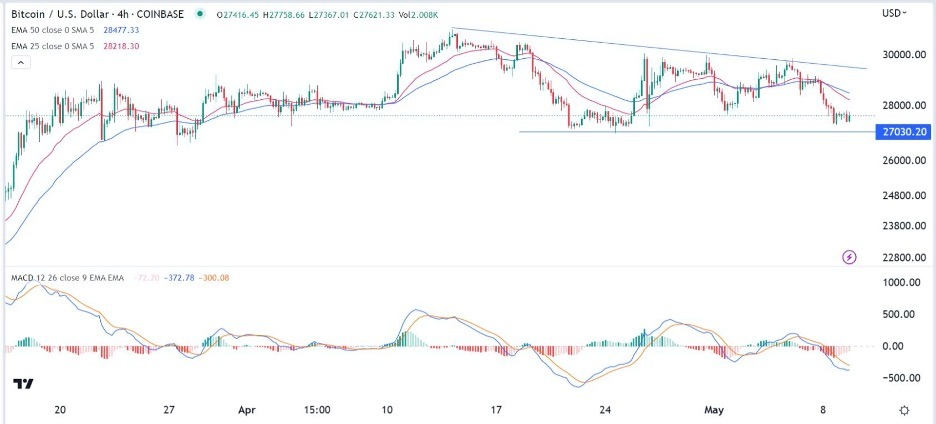
The BTC/USD exchange rate has been in a bearish trend after it peaked at 31,000 earlier this year. It has formed a slanting trendline that connects the highest points since April. Along the way, the pair has dropped below the 25-period and 50-period moving averages,
The pair has also formed a small bearish flag pattern, which is usually a bearish sign. It is also stuck at an important level, which was the lowest point on May 2. The MACD and the Relative Strength Index (RSI) have continued retreating.
Therefore, the pair will likely have a bearish breakout, with the next level to watch being at 27,000 the lowest level on April 24. A break below that level will see the pair dropping to the next level at 26,000. However, a relief rally to 29,000 cannot be ruled out in the near term.

Ready to trade our daily Forex signals? Here’s a list of some of the top 10 forex brokers in the world to check out.
