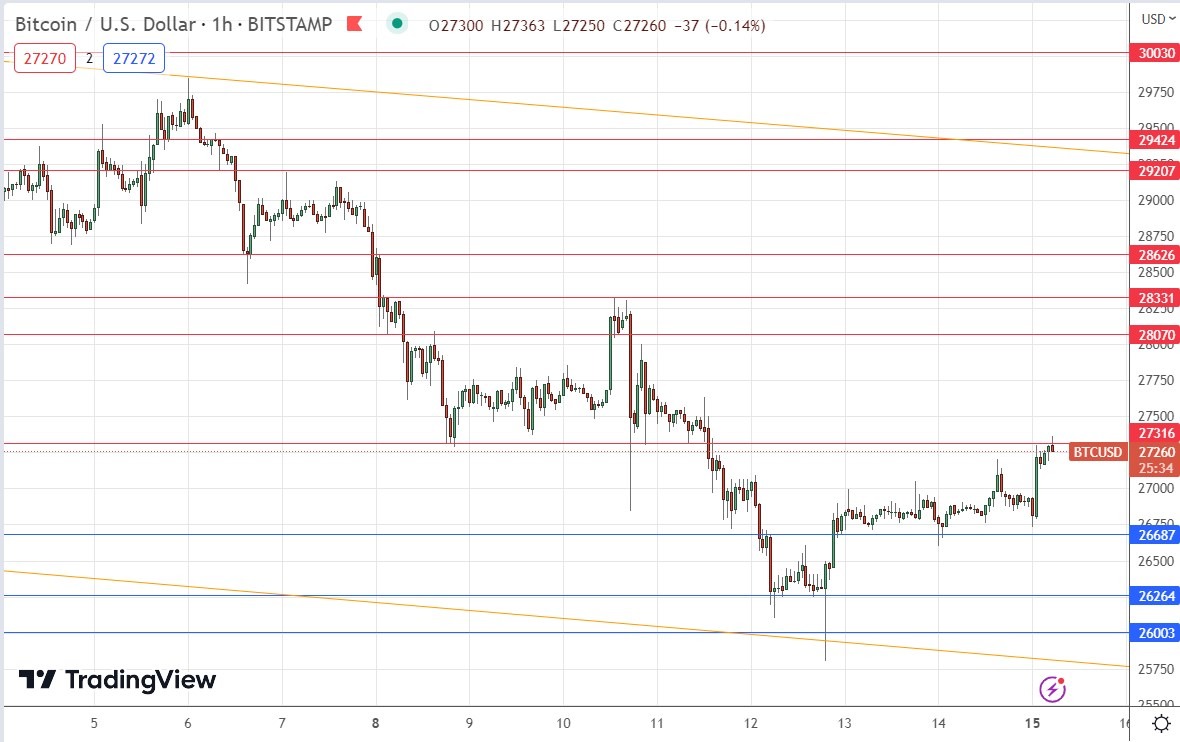
My previous BTC/USD signal on 1st May was not triggered, as there was no bullish price action when the support level identified at $27,874 was first reached.
Today’s BTC/USD Signals
Risk 0.50% per trade.
Trades must be taken prior to 5 pm Tokyo time Tuesday.
Long Trade Ideas
- Long entry after a bullish price action reversal on the H1 timeframe following the next touch of $26,687, $26,264, or $26,003.
- Place the stop loss $100 below the local swing low.
- Adjust the stop loss to break even once the trade is $100 in profit by price.
- Remove 50% of the position as profit when the trade is $100 in profit by price and leave the remainder of the position to run.
Short Trade Ideas
- Short entry after a bearish price action reversal on the H1 timeframe following the next touch of $27,316, $28,070, $28,331, or $28,626.
- Place the stop loss $100 above the local swing high.
- Adjust the stop loss to break even once the trade is $100 in profit by price.
- Remove 50% of the position as profit when the trade is $100 in profit by price and leave the remainder of the position to run.
The best method to identify a classic “price action reversal” is for an hourly candle to close, such as a pin bar, a doji, an outside or even just an engulfing candle with a higher close. You can exploit these levels or zones by watching the price action that occurs at the given levels.
BTC/USD Analysis
I wrote in my previous BTC/USD analysis on 1st May that the technical picture had become more bearish following a double top chart pattern completed by the second rejection of the resistance level at $30,030 and the decisive breakdown below the new resistance level at $28,740. However, I also thought that there would be support as nearby as the $28k area.
This was an excellent call as it forecasted precisely what happened that day.
We see over the longer term, the price has been contained by a very wide, bearish price channel that led to the price as low as $25,800 last Friday, when the price made a strong bullish rejection, from where it has risen somewhat. At the time of writing, bulls are trying to push the price up past the key resistance level at $27,316 but failing.
The short-term trend is clearly bullish, but it is unclear how much longer that will continue. The longer-term trend is certainly bearish.
I think the resistance level at $27,316 looks very strong, as we can see it acted last week as strong support before it finally broke down.
If the current embryonic bearish rejection of $27,316 continues, and we see a strong lower close on the hourly chart as the London session gets underway with the level holding cleanly, that could be a good short trade entry opportunity.
The resistance at $27,316 is likely to be today’s pivotal point – if the price can get established above it with two consecutive higher hourly closes following the London open, the price could rise as high as the area of resistance at $28k today.

Concerning the US Dollar, there will be a release of Empire State Manufacturing Index data at 1:30pm London time.
Ready to trade our daily Bitcoin signals? Here’s our list of the best crypto CFD brokers for your review.
