Bullish view
- Buy the BTC/USD pair and set a take-profit at 29,000.
- Add a stop-loss at 27,000.
- Timeline: 1-2 days.
Bearish view
- Set a sell-stop at 27,300 and a take-profit at 26,500.
- Add a stop-loss at 29,000.
The BTC/USD price drifted downwards as American equities retreated. Bitcoin, which rose to $28,447 on Monday, declined to a low of $27,693 during the American and Asian sessions. It remains ~7% above the lowest point during the weekend.
Fear and greed index rising
Bitcoin price dropped slightly as concerns about the economy continued. In the United States, the Dow Jones, Nasdaq 100, and S&P 500 indices dropped by more than 0.50%. The commodities market was also in the red, with the price of crude oil falling by more than 4%.
This performance happened even after the US published better-than-expected economic data. According to Conference Board, the country’s consumer confidence dropped to 102.3 in May, better than the expected drop to 99.2. This is an important figure because consumer spending is the biggest part of the American economy.
Meanwhile, the housing numbers were also good. The data revealed that the house price index rose by 0.6% in March and by 3.6% from the same period in 2022. These numbers, together with the strong inflation data published on Friday, means that the Fed could be forced to hike rates in June.
Bitcoin also declined even as the fear and greed index rose, signaling that investors have embraced a risk-on sentiment. The index jumped to the greed area of 67 as Nvidia hit a market cap of over $1 trillion despite annual profits of less than $5 billion.
Bitcoin price also retreated despite the strong performance of Ordinals. Data shows that Bitcoin now has over 10 million Ordinals inscriptions. Ordinals NFTs have become the fastest-growing areas in the blockchain industry.
BTC/USD technical analysis
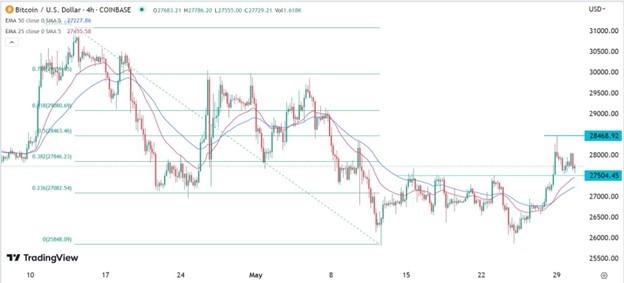
The BTC/USD pair has been in a slow bullish trend in the past few days. This rebound saw it rise to the key resistance point at 28,468, the highest point since May 8 of this year. It then pulled back and retested the key support level at 27,505 (May 15, 17, and 23rd highs). A break and retest is usually a bullish sign.
Bitcoin has moved above the 25-period and 50-period exponential moving averages (EMA) and is slightly below the 38.2% Fibonacci Retracement level. Therefore, the pair will likely have a bullish breakout as buyers target the next psychological level at 29,000. This view will be confirmed if it moves above this week’s high of 28,468.
Ready to trade our daily Forex signals? Here’s a list of some of the top 10 forex brokers in the world to
check out.


