Advertisement
Bullish view
- Buy the EUR/USD pair and add a take-profit at 1.1075.
- Add a stop-loss at 1.0900.
- Timeline: 1-2 days.
Bearish view
- Set a sell-stop at 1.0943 and a take-profit at 1.0850.
- Add a stop-loss at 1.1050.
The euro has gone nowhere this week as the recent rally faded. The EUR/USD pair was trading at 1.0900 on Thursday, a few pips below the year-to-date high of 1.1088. This performance coincided with the performance of the US dollar following encouraging inflation numbers.
ECB and Fed divergence
There are signs that the Federal Reserve and the European Central Bank (ECB) will adopt a divergent path going forward. Last week, the two central banks decided to hike rates by 0.25%. Now, there is a possibility that the ECB will continue hiking rates while the Fed will have a strategic pause.
The case of a Fed pause was made on Wednesday when the US published the latest consumer price index (CPI) data. According to the statistics agency, the headline inflation figure dropped to 4.9% in April, continuing the trend that has existed in the past few months. Core inflation also fell to 5.4%.
There is a possibility that America’s inflation will continue easing in the coming months since the price of crude oil and natural gas has eased recently. Brent was trading at $76.44 on Wednesday, much lower than the year-to-date high of over $90. Similarly, the West Texas Intermediate (WTI) fell to $72.6. Natural gas has also fallen to $2.18.
Falling oil and gas prices leads to lower transport costs, which have a positive impact on inflation. Therefore, the Fed has no major incentive to hike since central banks that paused like Bank of Canada have seen inflation ease.
On the other hand, European inflation remains at an elevated level, meaning that the ECB has more room to cover on rate hikes. I expect that the bank will deliver at least two more rate hikes this year.
EUR/USD technical analysis
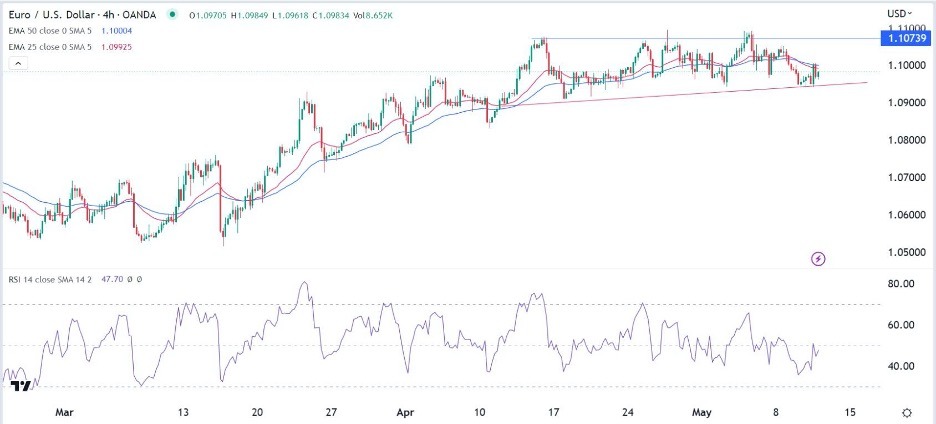
The EUR/USD pair is sending mixed signals since it has formed two unique chart patterns on the 4H chart. It has formed a triple-top pattern, which is usually a bearish sign. The upper part of this pattern is at 1.1073.
At the same time, this pattern can be said to be an ascending triangle pattern whose lower side connects the lowest points since April 17. Technical indicators are also moving sideways. Therefore, the outlook of the pair is neutral and I expect it to remain in this range on Thursday since there is no scheduled news.
 Ready to trade our free trading signals? We’ve made a list of the top 10 forex brokers in the world for you to check out.

