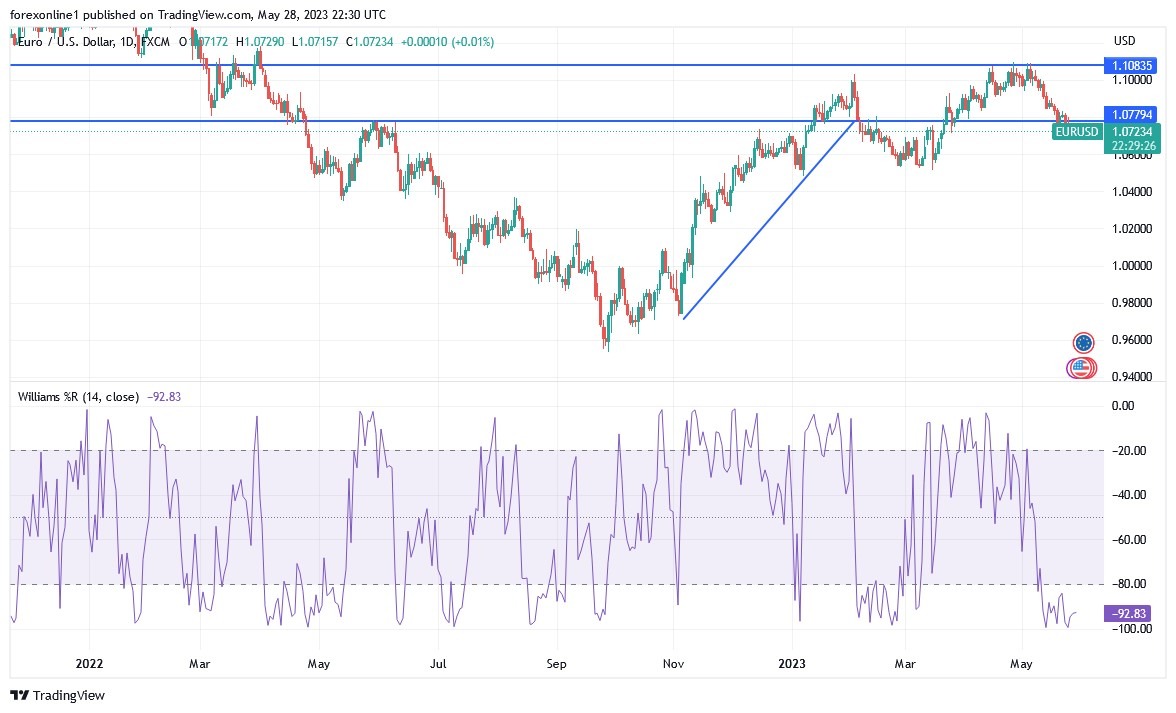
The EUR/USD exchange rate experienced volatile trading ahead of last weekend after the US Federal Reserve's (Fed) preferred inflation measure confirmed the continuation of stubbornly rising price pressures in April while also appearing to highlight domestic consumption. As a result, the price of the EUR/USD currency pair moved towards the next psychological support level 1.0700, its lowest in more than two months. It closed the week's trading stable around the level of 1.0725.
The negative momentum on the EUR/USD's performance increased after the US Bureau of Economic Analysis said that personal consumption expenditures inflation accelerated both monthly and annually in April. Both the general and core measures of the Fed's preferred measure of inflation suggested an increase in price pressures for the month of April, each recording an increase of 0.4% on the month to lift the annual pace from 4.2% to 4.4% overall, and from 4.6% to 4.7% once, putting nutrients and energy aside.
Commenting says Ian Shepherdson, analyst at Pantheon Macroeconomics. “But it is still within the range of the past two years, as the chart shows, and the final breakout to the downside is still a long way off.
The core PCE inflation rate is the most closely watched by FOMC members and has risen further above the core rate of inflation after passing the last measure in March. But the core PCE rate was higher in April if accommodation rental prices are aside, which is important because the Fed has said it will overlook it when assessing the strength of core price pressures because they tend to increase with interest rates, as well as as a result of higher interest rates.
According to some analysts, there is a risk of any further increase in US interest rates, which leads to a further reduction in interest rates in the near future, and that the data increases the risks of the June increase, but they believe that borrowing costs are most likely to be left unchanged.
The same Bureau of Economic Analysis report last Friday indicated that personal consumption expenditures increased by 0.8% in April and by 0.5% after adjusting for inflation, with more than half of spending going towards goods and the rest going into services. For his part, Catherine Judge, an economist at CIBC Capital Markets, says: “Looking to the future, the decline in the savings rate indicates that this pace of consumption is not sustainable, with labor income gains slowing along with employment.” Separately, April durable goods orders data delivered a bullish surprise in major categories that are a leading indicator of business investment in equipment. The core capital goods group (such as defense and transportation) showed a rebound in orders of 1.4%. ,”
The US Federal Reserve raised its interest rate to between 5% and 5.25% earlier this month and indicated uncertainty about the outlook for future borrowing costs, while FOMC members in general seemed to have recently united around the idea. Leave interest rates unchanged next month.
EUR/USD Technical Analysis:
- EUR/USD has been forming lower highs connected to a downtrend line, and it looks like another pullback to this resistance area is underway.
- The Fibonacci retracement tool is showing additional levels where sellers may wait.
- As the 38.2% level is at 1.0743, then the 50% level is closer to the trend line and 1.0750 is a secondary psychological sign.
- A higher correction could reach 61.8% Fibonacci retracement at 1.0766 near the 100 SMA dynamic inflection point.
On the subject of moving averages, the 100 SMA is below the 200 SMA to indicate that the overall trend is still bearish or that selling is more likely to resume than to reverse. In this case, EUR/USD may revisit lows around 1.0700 soon.
At the same time, the stochastic is still moving upwards to reflect the bullish pressure, so the correction can continue until the oscillator reaches overbought levels and turns downwards. The RSI has more room to run before signaling exhaustion among buyers, so the pullback could be larger. However, a break above the trend line and the 200 SMA dynamic resistance at the swing high could indicate that a reversal is in progress.
Ready to trade our Forex daily forecast? We’ve shortlisted the best currency trading platforms in the industry for you.


