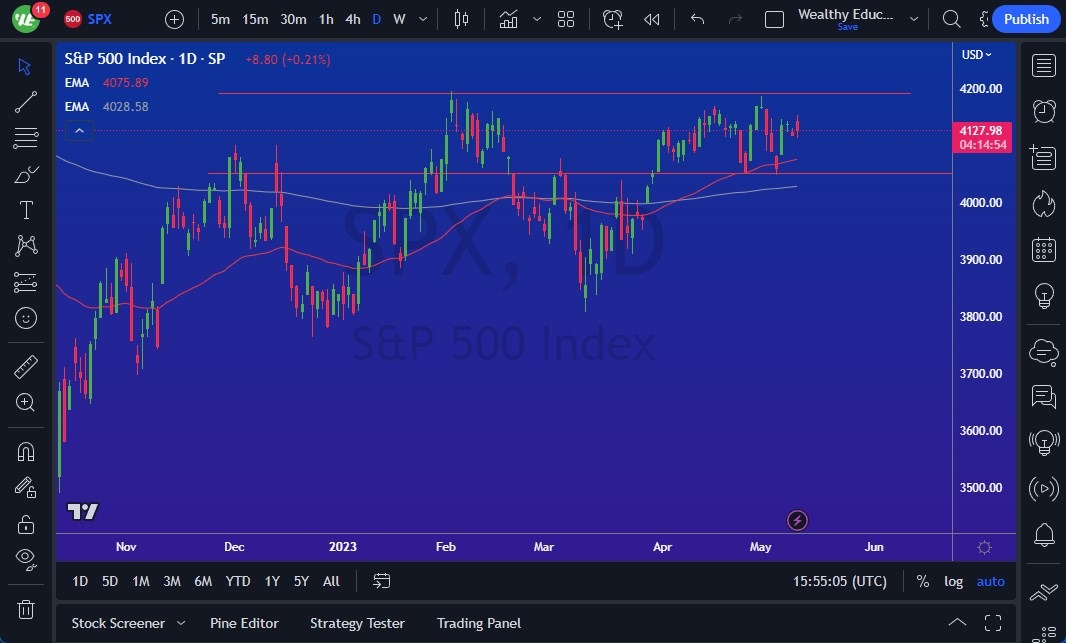
The S&P 500 rallied during Wednesday's trading session, as the market attempted to breach the major resistance barrier at the 4200 level. If the market can break above this level, it would be a bullish sign, as traders continue to bet that central banks will loosen monetary policy.
However, the cooler-than-anticipated CPI number on Wednesday suggests that traders may start to bet on the Federal Reserve trying to loosen monetary policy, which could lead to more volatility in the market. The 50-Day EMA sits around the 4100 level, and if the market breaks down below this level, it could potentially go down to the 4000 level, which is the bottom of the overall consolidation area.
Furthermore, when looking at the chart, a potential megaphone pattern is starting to emerge, which could be a negative sign. This pattern is characterized by increased volatility and a struggle to continue holding onto gains. While it is too early to trade this pattern, it is something to pay attention to.
If the market does break above the 4200 level, the next resistance barrier is at the 4300 level. A move above this level should be seen as a longer-term "buy-and-hold" signal, with the potential for a big move.
Volatility Ahead
- On the other hand, if the market breaks down below the 4000 level, it could potentially go looking for support at the 3800 level, which is a major support level.
- Ultimately, the market is likely to see a lot of volatility, given the uncertainty surrounding monetary policy and the emergence of the potential megaphone pattern.
- As such, traders will need to pay close attention to the key levels of support and resistance and be prepared for potential breakouts in either direction.
TL; DR: the S&P 500 is facing a major resistance barrier at the 4200 level, which could be breached if traders continue to bet on central banks loosening monetary policy. However, the cooler-than-anticipated CPI number on Wednesday suggests that traders may start to bet on the Federal Reserve trying to loosen monetary policy, which could lead to increased volatility in the market. Additionally, the emergence of a potential megaphone pattern could be a negative sign, further contributing to volatility. Traders will need to pay close attention to the key levels of support and resistance and be prepared for potential breakouts in either direction.

Ready to trade our Forex daily forecast? We’ve shortlisted the top forex brokers in the industry for you.


