Top Forex Brokers
Bearish view
- Set a sell-stop at 25,320 and a take-profit at 24,000.
- Add a take-profit at 27,000.
- Timeline: 1-2 days.
Bullish view
- Set a buy-stop at 26,500 and a take-profit at 28,000.
- Add a stop-loss at 24,500.
Bitcoin price continued to diverge from American stocks as regulatory concerns continued. The BTC/USD pair was trading at ~25,800 on Tuesday morning as attention turned to the upcoming US consumer price index (CPI) data and the Federal Reserve interest rate decision.
Monetary policy and regulatory concerns
Bitcoin has moved sideways in the past few days as traders assess the impact of last week’s lawsuit of the two biggest companies in the industry. The lawsuits do not mention Bitcoin directly. Instead, the SEC alleges that the two exchanges provide tokens that it deems to be securities. In Coinbase’s case, the agency also targets staking, which allows people to earn a return.
A good number of investors have pulled out their crypto investments from these investments. Binance has lost over $3.3 billion in assets in the past seven days. Other exchanges like Coinbase and OKX have seen their assets drop gradually. In the long run, it is unclear how these actions by the SEC will impact the crypto industry.
The BTC/USD price will next react to the upcoming American inflation data that will come out later today. Analysts believe that the numbers will show that the country’s consumer inflation dropped once again in May.
These numbers will come a day before the Federal Reserve makes its decision. The consensus view among traders is that the Fed will decide to leave interest rates unchanged between 5% and 5.25%. It will be the first time in ten meetings that the bank will not hike.
A Fed pause could point to an eventual pivot, which will be a good thing for risky assets like cryptocurrencies and stocks. Indeed, American stocks have been in a strong bullish trend in the past few months.
BTC/USD technical analysis
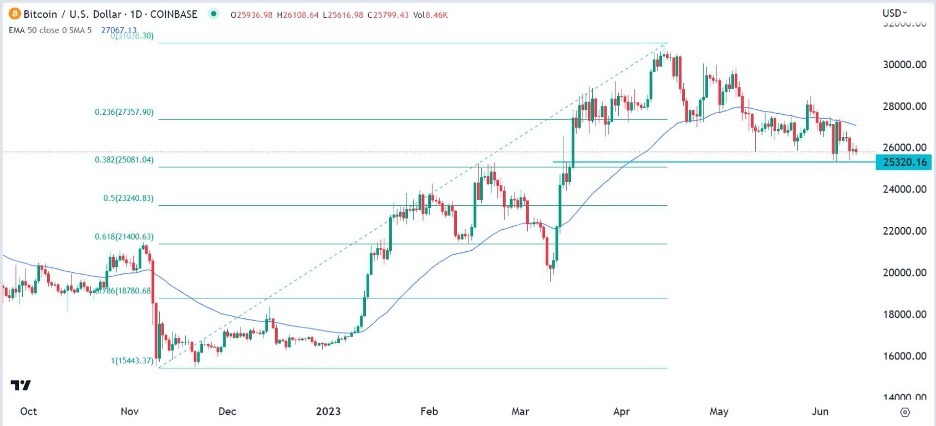
Bitcoin has been in a slow downward trend in the past few weeks. A closer look shows it has failed to move below the key support level at 25,320. This signals that short sellers are afraid of moving below this level, which also coincides with the 38.2% Fibonacci Retracement level.
Meanwhile, technical indicators point to more downside. For example, the 50-day moving average shows that Bitcoin could continue falling in the near term,
Therefore, in this case, the support level to watch is 25,320. If Bitcoin flips this support into resistance, it will see the BTC/USD pair drop all the way to 24,000. A daily close above the resistance at 27,000 (50 EMA), will lead to more upside.
 Ready to trade our free daily Forex trading signals? We’ve shortlisted the best MT4 crypto brokers in the industry for you.

