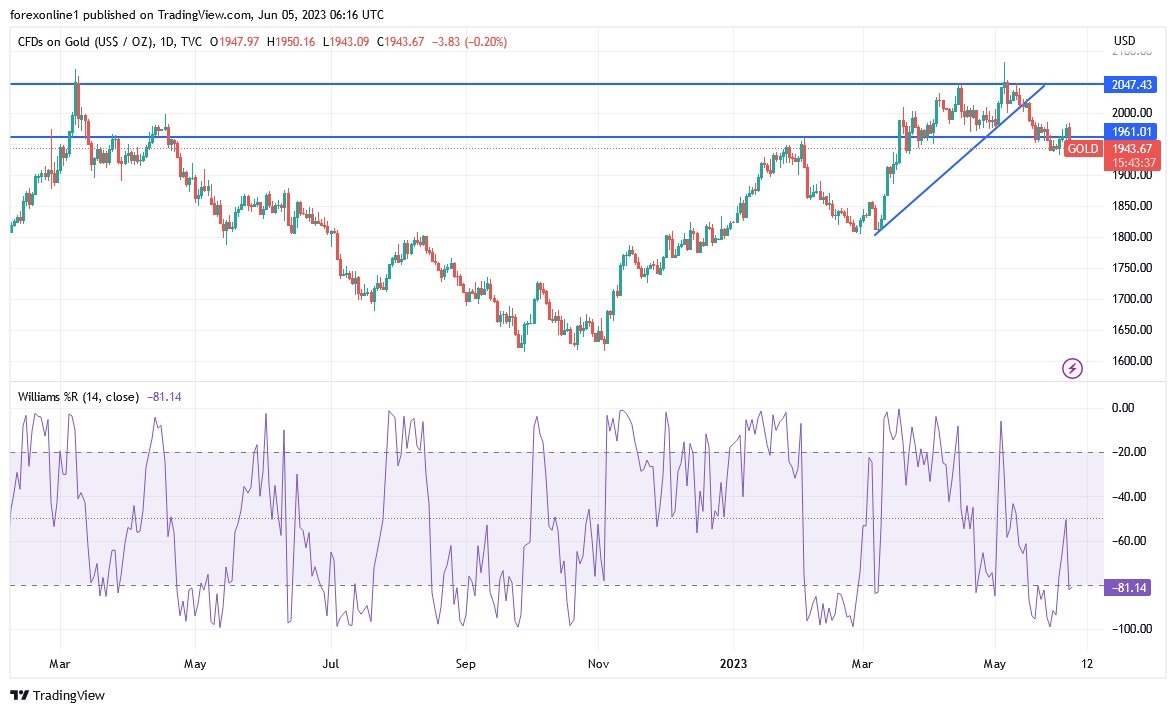
By the end of last week's trading, XAU/USD gold price reversed its bullish path, which pushed it towards the $1983 resistance level. This motivated the bulls to return to the vicinity of the $2000 psychological resistance again. It was subjected to strong selling operations on Friday, which pushed it towards the support level of 1948 dollars an ounce, which closed trading around it. The collapse was due to the strong recovery of the US dollar after amazing numbers for the US labor market. After the recent performance, it seems that the XAU / USD gold price has found a strong resistance within forming an ascending channel.
Gold price is still several levels above the 100-hour moving average line. As a result, it appears that the price of the yellow metal is approaching the overbought levels of the 14-hour RSI.
All in all, gold's current rally really strengthened in early May, rising 26.3% in 7.2 months to $2050 on the fourth day! That was within striking distance of an all-time record closing high for the yellow metal at $2,062 in early August 2020. The latest gold tick came a day after the Federal Reserve's Federal Open Market Committee (FOMC) raised the federal funds rate by 25 basis points. last. It indicates an average range of 5.13%.
The movement of gold prices in the short term is generally dominated by speculators, due to the intense leverage inherent in this area. They are looking to the US dollar for their fundamental trading signals. With the gold price rallying in early May at and after that last FOMC meeting, USDX has been drifting near its recent lows. In a bear market after last year's inflationary war caused by extreme rate hikes by the Fed, it hit an 11.7-month low in mid-April.
The seasonal decline in the price of gold for the month of May sparked US payrolls on Friday the fifth with a loss of 1.6%. This was mostly driven by another big bullish surprise in the monthly US jobs report for April, which reportedly reported 253k jobs added compared to the +180k expected. However, gold's recovery late in the day was marred by comments from the St. Louis Fed President. The Federal Reserve is actually a central banking system made up of twelve regional banks.
That afternoon, he told reporters, "The aggressive policy we've had in the past 15 months has stopped rising inflation, but it's not clear that we're on track" to the federal inflation target of 2%. He declared that he would need to see "meaningful declines in inflation" to convince him that further rate hikes were not necessary. Traders listen carefully when the Fed's top officials speak, as futures moves indicate the odds of an interest rate hike accordingly.
According to economic analysis
The XAU/USD gold price is trading affected by the results of the latest economic data, as the US employment change in the ADP for May exceeded the number of expected jobs at 170 thousand by counting 278 thousand. On the other hand, the ISM Manufacturing PMI for the month missed the expected reading of 47 with a reading of 46.9. The ISM index of manufacturing prices paid and the index of new orders lost expectation by 52 with a reading of 44.2 and 44.9 with a reading of 42.6 respectively. The ISM Manufacturing Employment Index beat the expected reading of 49.8 with a reading of 51.4, while last week Initial Jobless Claims outperformed the expected number of claims at 235K with a slight decrease at 232K.
Technical analysis of gold prices XAU/USD:
- In the near term, and according to the performance on the hourly chart, it appears that the XAU/USD gold price is trading within a bullish channel formation.
- This indicates a significant short-term bullish bias in market sentiment.
- Therefore, the bulls will look to extend the current range of gains towards $1975 or higher to $1982.
- On the other hand, the bears will target profits at around $1943 or lower at $1930 an ounce.
On the long term and according to the performance on the daily chart, it appears that the gold price XAU / USD is trading within a bearish channel formation. This indicates a significant long-term bearish bias in market sentiment. Therefore, the bulls will target potential bounces around $2013 or higher at $2053. On the other hand, the bears will target long-term profits at around $1937 or lower at $1898 an ounce.
Ready to trade our Gold forecast? We’ve shortlisted the best Gold brokers in the industry for you.


