Top Forex Brokers
My previous BTC/USD signal on 10th July was not triggered as there were no bearish price action when the resistance level at $30,605 was first reached that day.
Today’s BTC/USD Signals
Risk 0.50% per trade.
Trades may only be entered before 5 pm Tokyo time Thursday.
Long Trade Ideas
- Go long after a bullish price action reversal on the H1 timeframe following the next touch of $29,424 or $29,207.
- Put he stop loss $100 below the local swing low.
- Move the stop loss to break even once the trade is $100 in profit by price.
- Take off 50% of the position as profit when the trade is $100 in profit by price and leave the remainder of the position to ride.
Short Trade Ideas
- Go short after a bearish price action reversal on the H1 timeframe following the next touch of $30,449 or $31,604.
- Put the stop loss $100 above the local swing high.
- Move the stop loss to break even once the trade is $100 in profit by price.
- Take off 50% of the position as profit when the trade is $100 in profit by price and leave the remainder of the position to ride.
The best method to identify a classic “price action reversal” is for an hourly candle to close, such as a pin bar, a doji, an outside or even just an engulfing candle with a higher close. You can exploit these levels or zones by watching the price action that occurs at the given levels.
BTC/USD Analysis
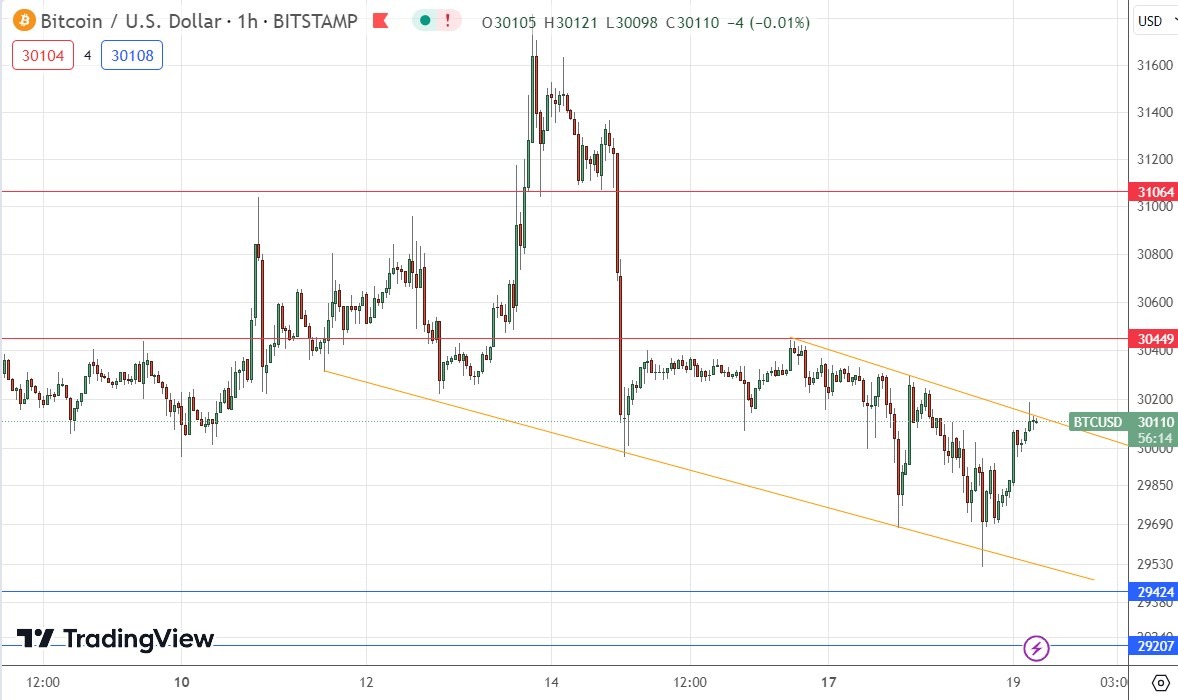
I wrote in my previous BTC/USD analysis on 10th July that we had a very pivotal area of resistance close above in the $31k area but also very firm support just below the big round number at $30k. I was looking for a long trade from a bullish bounce at support.
My call was of no consequence, as the price did not get below $30k that day.
Since then, we have seen the $31k area continue to hold as firm resistance, but we have also seen the price continue to rebound from the supportive area below $30k. However, that area of support is starting to come into question as the price persists in moving down. Technically, this short-term downwards price movement is supported by the descending trend line shown in the price chart below, which is arguably becoming a bearish channel. This is likely to continue to move the price down to the nearest support level at $29,424.
It is interesting that while US stocks are taking off, Bitcoin remains unable to break above $31k and stay there – stocks and Bitcoin usually show a positive correlation.
I am still ready to take a long trade today from a bullish bounce at $29,424. However, if the price gets established below that level, it could be very pivotal, and trigger a sharp fall.

There is nothing of high importance scheduled today concerning the US Dollar.
Ready to trade our daily Bitcoin signals? Here’s our list of the best crypto brokers worth checking out.

