Bullish view
- Buy the BTC/USD pair and set a take-profit at 32,000.
- Add a stop-loss at 29,000.
- Timeline: 1-2 days.
Bearish view
- Sell the BTC/USD pair and set a take-profit at 29,000.
- Add a stop-loss at 31,000.
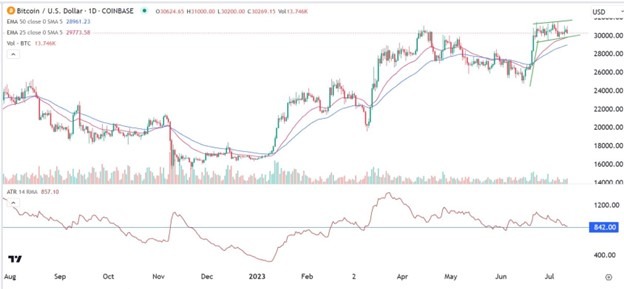
The BTC/USD price remained in a deep slumber even as the US dollar index plunged and American stocks jumped. The pair remained stuck above the key support level at 30,000 where it has been at this month. It remains much higher than last month’s low of 24,858.
Top Forex Brokers
US dollar index is falling
The BTC/USD pair has continued consolidating even as other financial assets made some important moves. American equities were deeply in the green, with the Dow Jones and Nasdaq 100 indices jumping by more than 300 points.
At the same time, the CBOE VIX index dropped below $15 as volatility in the market reduced. Further, the closely watched US dollar index (DXY) crashed to a multi-month low of $100. This means that the index has dropped by almost 15% from its highest level this year.
Meanwhile, the bond market also made some gains, which pushed yields lower. The 10-year bond yield fell to 3.83% while the 30-year fell to 3.9%.
This price action happened as investors reacted to the latest US inflation numbers. The headline consumer price index (CPI) dropped from 4.1% in May to 3% in June. Core inflation also dropped to 4.8%.
These numbers came a few days after the US published mixed jobs numbers. While the US unemployment rate dropped to 3.6%, the economy added just 209k jobs. Therefore, these numbers mean that the Federal Reserve will likely deliver one more rate hike this year.
It is unclear why Bitcoin reacted mildly to the inflation numbers as other financial assets performed as expected. A likely reason is that activity in the crypto industry has been a bit muted in the past few days as evidenced by the low liquidation data.
BTC/USD technical analysis
Bitcoin’s volatility has dropped sharply in the past few days. The Average True Range (ATR) indicator has dropped to the lowest point since June 5th. On the daily chart, the pair has formed a bullish flag pattern while the volume has been a bit low. A flag is usually a sign of a bullish continuation.
Therefore, Bitcoin will likely remain in this consolidation phase and then make a bullish breakout in the coming days. This breakout will be confirmed if it moves above the upper side of the flag pattern at 31,400.
Ready to trade BTC/USD? Here’s a list of some of the best crypto brokers to check out.

