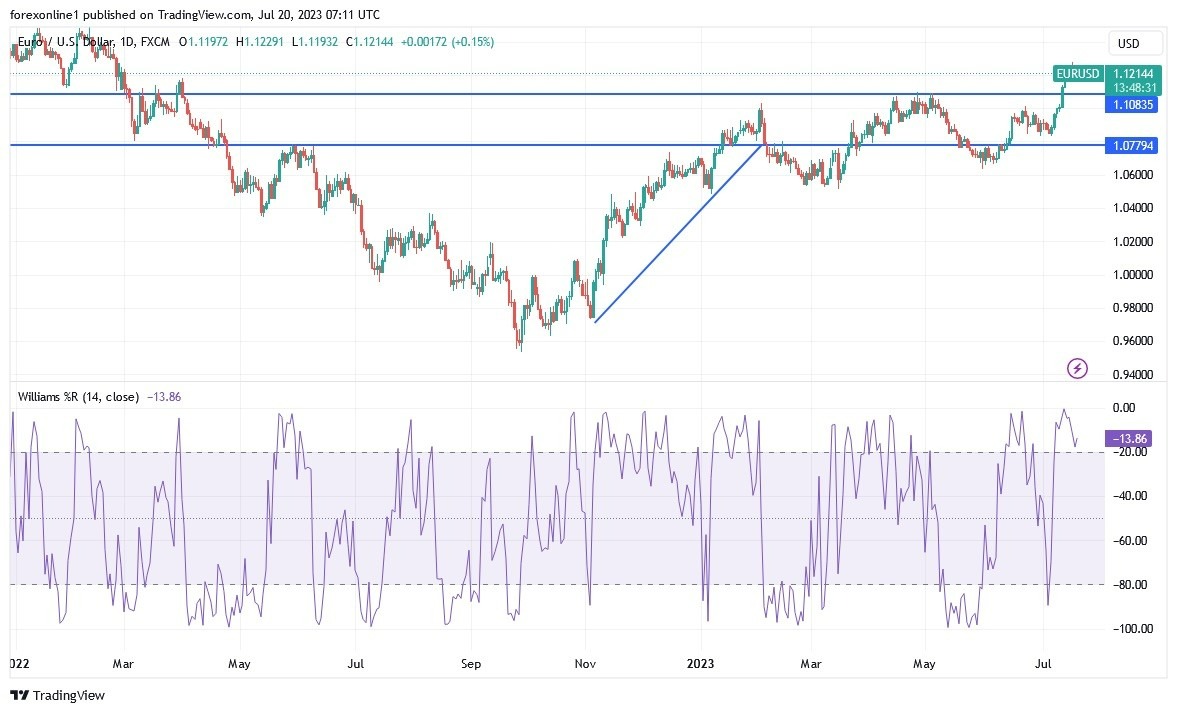
During yesterday's trading session, the price of the euro currency pair against the US dollar, EUR/USD, was exposed to limited selling operations that pushed it towards the 1.1175 level, before it returned to stability around the 1.1225 level at the time of writing the analysis. Prior to the announcement of the number of US jobless claims, the reading of the Philadelphia Industrial Index and the existing US home sales, then the Eurozone consumer confidence reading.
Top Forex Brokers
The gains of the recent bullish rebound for the euro/dollar pair extended to the resistance level at 1.1275. As expectations increased for the European Central Bank to raise interest rates on the US Federal Reserve this time, especially after US inflation rates fell less than expected. The currency pair may remain in the upward rebound range until the final announcement from global central banks.
New technical analysis from City Index shows that EURUSD could decline in the near term before extending the broader rally, noting a rare “harmonic butterfly” pattern. In this regard, Fouad Razakzadeh, an analyst at City Index, says that the narrow range seen recently in the EUR/USD price comes amid “clearly overbought” conditions in the short term, and some weakness could occur from here. Accordingly, weakness could form around 61.8% Fibonacci retracement in the long term, against the 2021-2022 downside swing at 1.1275.
“However, the long-term outlook for the EUR/USD pair remains positive. The explosive break seen last week suggests that the EUR/USD bulls are likely to remain in control of the price action for a while now, especially since the long-term trend is also to the upside – look no further than the slope of the 200-day moving average,” he added.
He explains that this is where the price is expected to find resistance and turn lower. Fibonacci extension levels can be our guide, where the 127.2% extension comes from the BC leg at 1.1220. Here, we also saw some resistance, so it is possible that point D has already been reached, and a short-term top. Given the sharper movement in this CD leg compared to wave AB, the latter says that he wouldn't be surprised if the CD leg turned out to be larger than the AB leg.
Thus, a continuation towards the 161.8% Fibonacci extension level at 1.1380 is possible, before we see a temporary or long-term top for the EUR/USD pair. In terms of support, last Wednesday's high of 1.1140 is now very important to hold as far as the short-term outlook for EUR/USD is concerned. If that is broken then the April high of 1.1095 would be the next level to offer potential support or else we would see a revisit of the more important support around 1.10 psychological support.
EUR/USD Technical Outlook
- EUR/USD has now fallen to trade a few levels below the 100-hour moving average line. However, there still appears to be some room left to run before reaching the oversold levels on the 14-hour RSI.
- In the near term, and according to the performance on the hourly chart, it appears that the EUR/USD is trading within a limited bearish channel formation.
- This indicates a significant short-term bearish bias in market sentiment. Therefore, the bears will be looking to extend the current range of declines towards 1.1174 or below toward the support at 1.1145.
- On the other hand, the bulls - the bulls - will be looking for a bounce around 1.1229 or higher at the 1.1256 resistance.
In the long term, and according to the performance of the daily chart, it appears that the EUR/USD pair has recently completed the formation of a bullish XABCD pattern. This indicates a significant long-term bullish bias in market sentiment. Therefore, the bulls will be looking to extend the current rally towards 1.1393 or higher to the resistance at 1.1578. On the other hand, the bears will target long-term profits at around 1.1022 or below the support at 1.0837.

Ready to trade our Forex daily forecast? We’ve shortlisted the best FX trading platform in the industry for you.

