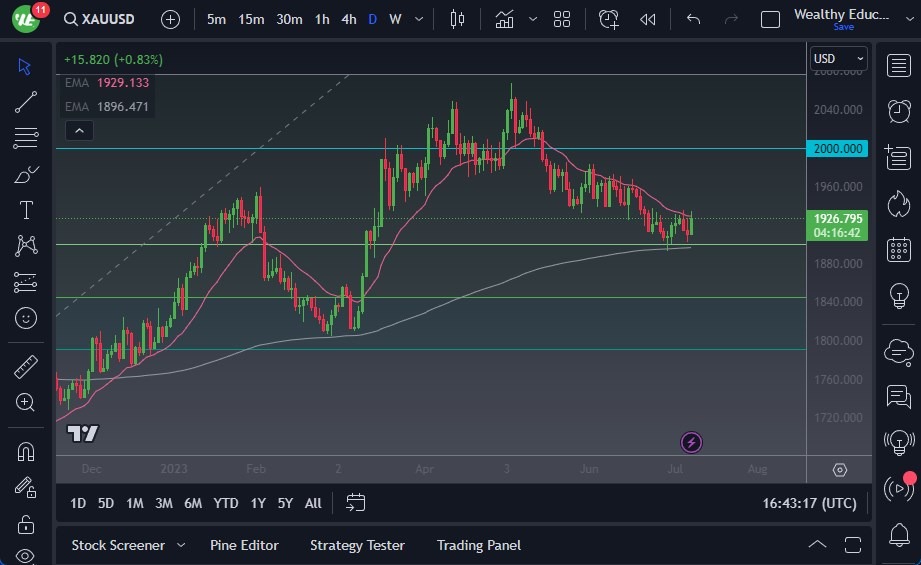
Friday's release of the Non-Farm Payroll numbers revealed the addition of 209,000 jobs in the previous month, falling short of the expected 225,000. Moreover, downward revisions to the previous month's figures suggest that challenges persist in the job market. In response, gold prices are attempting to establish a potential bottom around the 200-Day Exponential Moving Average, which coincides with the 61.8% Fibonacci retracement level. Given the market's inherent volatility, a prudent approach would be to identify value opportunities as they arise.
Top Forex Brokers
- A significant breakdown below the 200-Day EMA would be cause for concern, as it would breach a major technical indicator.
- It could potentially open the door for a decline below the $1900 level, with a possibility of reaching as low as $1800.
- However, the 61.8% Fibonacci level provides robust support, contributing to the prevailing noise and support in the market.
- Consequently, short-term pullbacks are expected to encounter substantial backing. If the market manages to break above the $1950 level, it could pave the way for further upward movement, potentially targeting the $2000 mark.
Considering the historically inverse relationship between the gold market and the US dollar, it is crucial to closely monitor the US Dollar Index. This correlation is likely to persist, contributing to market dynamics. Positioned between the 200-Day EMA and the 50-Day EMA, the gold market is poised for increased volatility. In this environment, the strategy of owning gold and purchasing it during dips appears favorable. However, navigating through the noise and volatility may present challenges. Once a breakout from this range occurs, it is reasonable to expect a more significant price movement.
Following the release of underwhelming Non-Farm Payroll data, the gold market is seeing support near key levels, namely the 200-Day EMA and the 61.8% Fibonacci retracement level. The market's noise and inherent volatility create an environment that calls for a discerning approach in identifying value opportunities. While a substantial breakdown below the 200-Day EMA would raise concerns, the significant support provided by the Fibonacci level reinforces the current range-bound movement. Short-term pullbacks are expected to attract solid support, while a break above the $1950 level could set the stage for a potential climb towards $2000. Investors should closely monitor the US Dollar Index for insights into the gold market's performance, given their historical inverse correlation. While the current range persists, owning gold and taking advantage of dips is an appealing strategy, but one that requires navigating through market noise. Once a breakout occurs, a more substantial price movement may unfold.
Ready to trade today’s Gold forecast? Here are the best Gold brokers to choose from.

