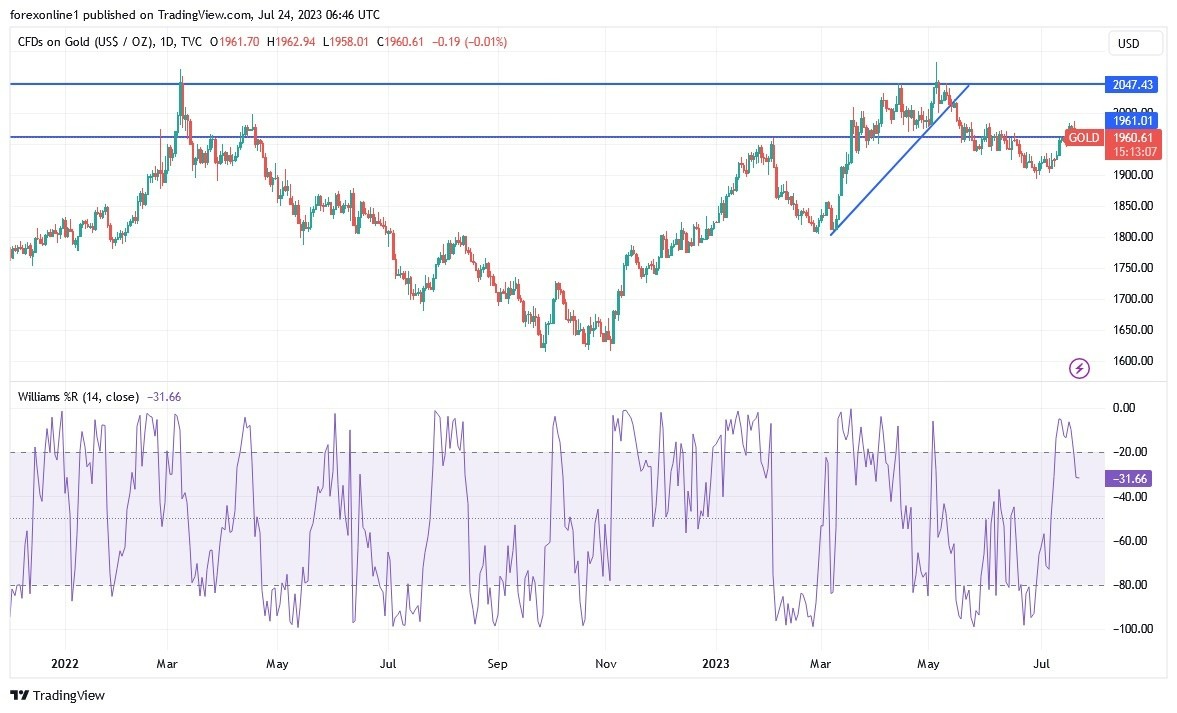
For three consecutive trading sessions, the gold price has moved in a limited downward correction path, in light of the US dollar's recovery ahead of the US Central Bank's policy decisions this week, in addition to the European Central Bank's and Bank of Japan's announcements. Gold losses reached the support level of 1956 dollars an ounce, before prices stabilized around the level of 1965 dollars an ounce, at the time of writing the analysis. So far, according to the performance on the daily chart, the gold price is still on an upward correction path, and as I mentioned before, the psychological resistance of $2,000 an ounce will remain an easy target for bulls, in case prices return toward the $1973 and $1985 resistance levels, respectively.
Top Forex Brokers
According to economic analysis, gold is trading affected by the results of recent economic data, as initial jobless claims in the United States outperformed the expected number of claims at 245 thousand by 228 thousand. Continuing claims for the prior period topped the forecast of 1.729 million with a tally of 1.754 million, while the Philadelphia Fed Manufacturing Survey for July came in below the forecast of -10 with a reading of -13.5.
Prior to that, US Building Permits for June missed the expected number of 1.49 million with a count of 1.44 million. Home starts during the period also fell short of the expected figure of 1.48 million, with 1.434 million. US Retail Sales for June missed expectations at 0.5% with a change of 0.2% (MoM). On the other hand, the retail sales watch group for the month beat the expected change of -0.3% with a change of 0.6%, while retail sales outside of automobiles lost 0.3% with a change of 0.2%.
Gold Technical Outlook
- Gold price is now trading below the 100 hourly moving average line. However, an early rebound on Friday prevented the XAU/USD gold price from falling to the oversold levels of the 14-hour RSI.
- In the short term, and according to the performance on the hourly chart, it appears that the gold price is trading within a bearish channel formation.
- This indicates a significant short-term bearish bias in market sentiment. Therefore, the bulls - the bulls - will be looking for a bounce around $1972 or higher at $1978 an ounce. On the other hand, the bears will target short-term profits at around $1960 or lower at $1952 an ounce.
In the long term, and according to the performance on the daily chart, it appears that the gold price is trading within a bullish channel formation. This indicates a significant long-term bullish bias in market sentiment. Therefore, the bulls will be looking to extend the current gain move to around $2,000 or higher to $2,045 an ounce. On the other hand, the bears will look to pounce on the gains around the $1931 support or below the $1891 support.

Ready to trade today’s Gold prediction? Here’s a list of some of the best XAU/USD brokers to check out.
