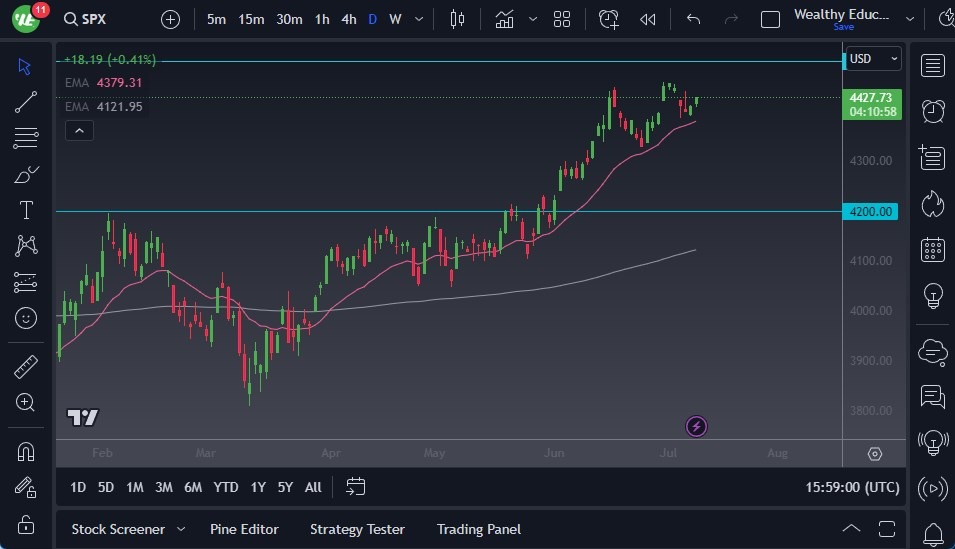
The S&P 500 displayed strength during Tuesday's trading session, propelled higher by overnight electronic trading. The market now sets its sights on the key resistance level of 4500, an important psychological threshold that has historically posed a challenge for the futures market. Amidst this ascent, the 4400 level offers support, as evidenced by the formation of a hammer candlestick pattern in the previous session. However, the market continues to exhibit noisy behavior, prompting investors to closely monitor potential breakout or reversal points.
Top Forex Brokers
- As the S&P 500 grinds higher, it encounters resistance near the 4500 level, which presents a formidable barrier for further gains.
- This level represents a large, round, and psychologically significant figure, adding weight to its significance.
- The recent price action suggests the formation of an ascending triangle pattern, which, if confirmed, could open up a potential upward move of approximately 120 points beyond the 4500 level.
On the downside, breaking below the 4350 level would signal a potential test of the 50-Day Exponential Moving Average as a technical support level. It is worth noting that a select few companies, particularly those related to artificial intelligence, are currently driving the S&P 500. Because of this, if there is a sudden change in the “AI narrative”, things could unravel quickly. The market continues to look for upward momentum, so I suspect that the traders on Wall Street will continue to try to develop more positive narratives going forward.
Despite the Federal Reserve's commitment to maintaining tight monetary policy, the Wall Street crowd appears relatively unconcerned. While an economic recession looms, investors are separating the performance of the economy from that of the stock market. It is important to trade based on the actual market conditions rather than speculative expectations.
The S&P 500 demonstrated resilience as it surged higher, targeting the significant resistance level of 4500. While this level poses a challenge, the formation of an ascending triangle pattern provides a potential bullish outlook. On the downside, the 4350 level serves as a crucial support zone, with the 50-Day EMA potentially offering additional technical support. Investors are advised to closely monitor breakout or reversal signals as the market exhibits both strength and noise. Despite concerns about a forthcoming recession, the market appears unfazed, emphasizing the importance of trading based on current conditions rather than hypothetical scenarios.
Ready to trade our S&P 500 analysis? Here’s a list of some of the best CFD brokers to check out.


