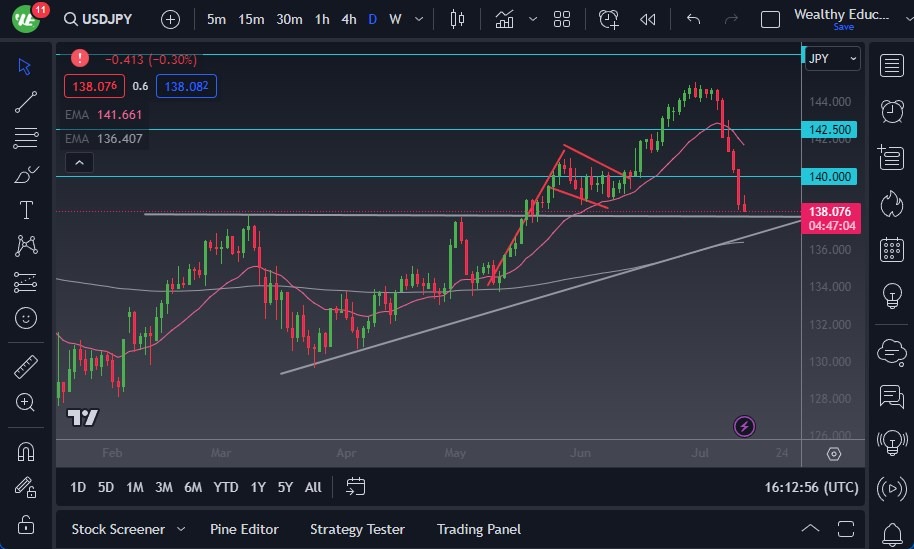
- The US dollar has shown signs of stabilization against the Japanese yen following a significant selloff.
- Currently, the USD/JPY pair appears to be attempting a turnaround, which is logical given that the ¥138 level previously served as the top of a consolidation area resembling an ascending triangle. If successful, the market may set its sights on the 50-Day Exponential Moving Average.
- Positioned around the ¥140 level, it could serve as a target. Considering the oversold condition of the market, it is plausible to expect value hunters to re-enter the market at this point.
However, it's important to note that if the market were to break below the ¥138 level, it could signal further downward movement. In such a scenario, the market might extend its decline toward the 200-Day EMA, located near the ¥136.50 level. This would offer a significant indication of the prevailing trend.
It is worth mentioning that the market is currently resting on the 61.8% Fibonacci level from the latest upward surge. Additionally, it finds itself at the bottom of the previous bullish flag, providing additional reasons to anticipate potential support. Moreover, the interest rate differential between the US dollar and the Japanese yen continues to favor the former.
Be Cautious
Furthermore, the market is currently oversold. While still in an overall uptrend, the recent pullback has been harsh due to expectations of the Bank of Japan implementing its next yield curve control move. However, compared to the Federal Reserve, the Bank of Japan remains far behind, which makes investors lean towards the US dollar over the Japanese yen. Consequently, a recovery in this area is anticipated, but it is crucial to recognize the potential for volatility. Confirmation of an upward move will be necessary before reinvesting capital.
Ultimately, the USD/JPY pair shows signs of attempting a reversal as the US dollar stabilizes against the Japanese yen. The previous consolidation level at ¥138 acts as a pivotal point, with a successful turnaround potentially leading to a target of the 50-Day EMA near ¥140. Conversely, a breakdown below ¥138 could indicate further downward movement toward the 200-Day EMA near ¥136.50. While the market currently finds support at the 61.8% Fibonacci level and the bottom of the previous bullish flag, the interest rate differential, and oversold conditions favor the US dollar. Despite the ongoing uptrend, caution should be exercised due to the potential for volatility, and confirmation of a higher move is necessary before recommitting funds.
 Ready to trade our Forex daily forecast? We’ve shortlisted the best currency trading platforms in the industry for you.

