- By the end of last week's trading, gold futures recorded tepid gains, recording a modest weekly increase.
- Investors watched the July jobs report, which divided Wall Street over whether the Fed will continue to tighten monetary policy after the latest employment data.
- The question now: Can the gold price return to $2,000 an ounce this month?
Top Forex Brokers
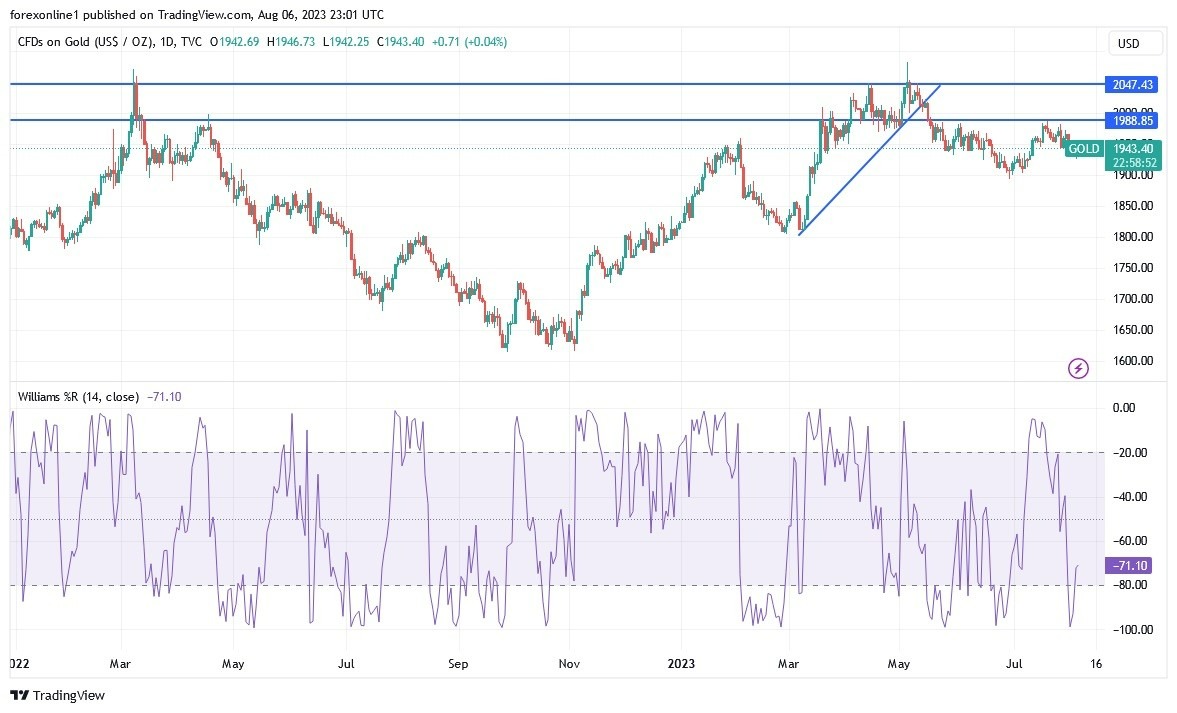
According to the trading, the gold price rose to the level of 1947 dollars an ounce, rebounding from strong losses that pushed it towards the support level of $1925, which is closest to testing the psychological support level of $1900. All in all, the gold price got a weekly jump of 0.8%, which adds to its gains since the beginning of the year 2023 to date by about 8%. In the same performance, silver prices, the sister commodity to gold, remained below $ 24. Silver futures fell to $23.67 an ounce. All in all, the price of the white metal fell by 3.29% last week, which sent silver prices to the 2023 year-to-date performance of -2%.
In general, everything was influenced by the latest US jobs numbers.
According to the Bureau of Labor Statistics (BLS), the US economy added a total of 187,000 new jobs in July, up from a revised 185,000 in June. Economists have projected 200,000 new jobs. The country's unemployment rate fell to 3.5%, while the labor force participation rate was unchanged at 62.6%. Average hourly earnings were unchanged at 0.4% month over month and 4.4% year over year, for a total of $33.74 per hour. The average weekly hours decreased to 34.3. All in all, the latest US jobs numbers have investors debating whether this will support a rate hike at the Federal Open Market Committee (FOMC) meeting in September. Meanwhile, financial market indices posted gains.
Meanwhile, US Treasury yields declined, with the benchmark 10-year yield dropping 10.3 basis points to 4.086%. The two-year note yield fell 7.8 basis points to 4.818%, while the 30-year note fell 7.5 basis points to 4.23%. Gold is usually sensitive to movements in interest rates because they can affect the opportunity cost of holding non-yielding bullion.
And a strong factor affecting the gold market. The US Dollar Index (DXY), a measure of the greenback against a basket of major currencies, fell to 101.83, from an opening of 102.54. Overall, the DXY is on track for a weekly loss of 0.2%, in addition to its year-to-date decline of 1.6%.
A weaker price is beneficial for dollar-denominated commodities because it makes them cheaper for foreign investors to buy.
Relative to other metals markets, copper futures fell to $3,861 a pound. September palladium and platinum futures remained unchanged at $937.00 and $1236.00 an ounce, respectively.
Gold Technical Analysis
Gold price remains a few levels below the 100 hourly moving average line. As a result, the yellow metal price continues to trade centered on the 14-hour RSI. According to the performance in the near term, it appears that the gold price is trading within a sideways channel formation. This indicates that there is no clear short-term directional bias in market sentiment.
Therefore, the bears will target the potential bearish breakout at around $1.923 or lower at $1.913 an ounce. On the other hand, the bulls - the bulls - will look to take profits around $1942 or higher at $1955 an ounce.
In the long term and according to the performance on the daily chart, it appears that the gold price XAU / USD is trading within a bearish channel formation. This indicates a significant long-term bearish bias in market sentiment. Therefore, the bears will be looking to extend the current range of declines towards $1892 or lower to $1852 an ounce. On the other hand, the bulls - the bulls - will look to pounce on profits at around $1,980 or higher at $2,025 an ounce.

Ready to trade our Gold forecast? We’ve shortlisted the most trusted Gold brokers in the industry for you.
