Top Forex Brokers
Bearish view
- Sell the GBP/USD pair and set a take-profit at 1.2100.
- Add a stop-loss at 1.2225.
- Timeline: 1-2 days.
Bullish view
- Set a buy-stop at 1.2180 and a take-profit at 1.2250.
- Add a stop-loss at 1.2100.
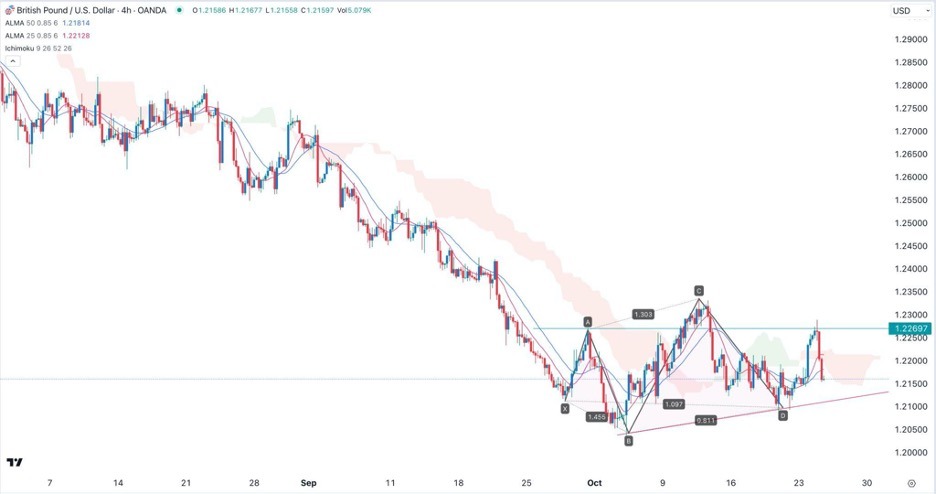
The GBP/USD exchange rate plunged sharply after the stronger-than-expected US manufacturing and services PMI numbers. Sterling retreated to a low of 1.2162 from this week’s high of near 1.2300.
US and UK divergence
The UK and the US are going through a major economic divergence. In a recent report, the IMF warned that the UK will be the slowest economy in the G7. The US, on the other hand, is holding quite well, with inflation showing signs of moderation.
Economic data published on Tuesday painted a picture of this situation. According to S&P Global, the UK services PMI rose slightly from 48.5 in September to 48.6 in October. The manufacturing PMI rose to 45.2, which is still lower than the expansion zone of 50.
US economic data sent a different picture about the economy. The services and manufacturing PMIs in the country rose to 50.9 and 50, respectively. These numbers mean that the economy is doing much better than the UK.
US and UK inflation figures have also diverged. The headline consumer price index (CPI) in the US dropped slightly to 3.6% in October as the price of gasoline has jumped. In the UK, the state of stagflation was seen in its inflation figure, which showed that inflation jumped to 6.7%.
Looking ahead, the next important catalysts for the GBP/USD pair will be the latest US new home sales data. Economists polled by Reuters expect the data to show that new home sales rose to 680k in September from the previous 675k.
Jerome Powell, the head of the Federal Reserve, will deliver a closely-watched statement. In it, he will likely talk about the state of the economy and what to expect in the coming meeting.
GBP/USD technical analysis
The GBP/USD exchange rate suffered a harsh reversal in the overnight session. It retreated below the Ichimoku cloud and the 50-period moving average. The pair slipped below the important resistance point at 1.2270, the highest swing on September 29th.
It has also formed what looks like a head and shoulders pattern. In price action analysis, this pattern is one of the most popular bearish signs. It has also completed the formation of the XABCD pattern.
Therefore, the pair will likely continue falling as sellers target the lower side of the red ascending trendline at 1.2100.
 Ready to trade our free daily Forex trading signals? We’ve shortlisted the best UK forex broker in the industry for you.

