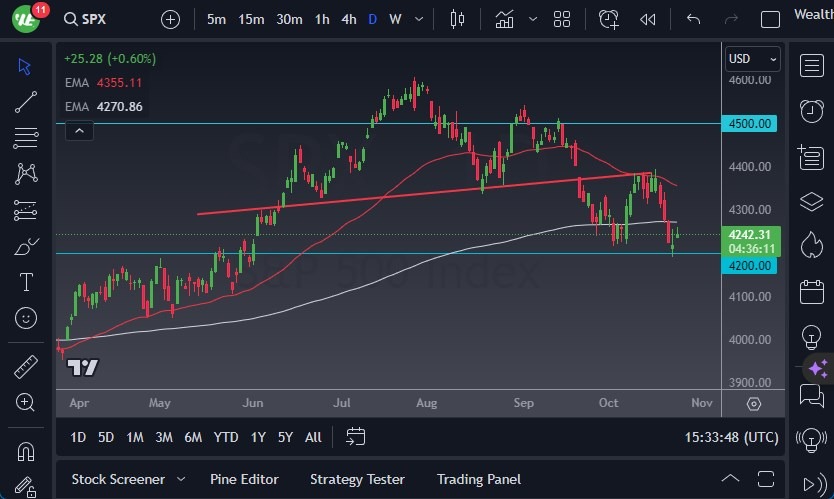
- The S&P 500 exhibited early signs of strength in Tuesday's trading session, but it did so amidst ongoing market volatility.
- It's essential to take note of the peculiar candlestick formation from the prior Monday's session—a doji, indicative of market indecision.
Top Forex Brokers
An important technical indicator, the 200-day EMA, hovers above, drawing the attention of many market participants. If the S&P 500 manages to breach this level, it's highly likely that the market will set its sights on the 50-day EMA as the next target.
Conversely, a downward break below the low of the Monday session's candlestick could trigger a significant sell-off, potentially driving the index down to the 4200 level. Beyond that lies the 61.8% Fibonacci level, a key indicator closely monitored by technical traders. A breach below this level could prompt a wave of selling pressure, resulting in what's often referred to as "FOMO trading."
Should the index successfully surpass the 200-day EMA, a short-term recovery might be in the cards. This would likely attract more market participants, bolstering sentiment. However, it's important to acknowledge that the S&P 500 is currently characterized by a high degree of noise. This noise is exacerbated by the ongoing earnings season in New York, which wields a substantial influence over market dynamics. In essence, the market is navigating a day-to-day situation, making it challenging to establish substantial positions.
A Day-to-day Approach is Advisable
It's crucial to recognize that the market has been caught in a downward drift for a notable period. Consequently, rallies have been relatively constrained. A substantial move higher is contingent upon breaking above the 50-day EMA. In such a scenario, the market would adopt a significantly bullish stance, potentially paving the way for a climb to recent highs. While this isn't necessarily anticipated, it remains a plausible outcome.
Ultimately, the S&P 500 exhibited early strength in Tuesday's trading session amidst ongoing market volatility. The 200-day EMA stands as a significant technical indicator, and its breach could set the stage for a rally to the 50-day EMA. Conversely, a downward break may precipitate a sell-off, with the 4200 level and the 61.8% Fibonacci level serving as critical support zones. Given the current market noise and the influence of the earnings season, a day-to-day approach is advisable, with substantial positions requiring careful consideration. The potential for a more substantial rally hinges on a break above the 50-day EMA, offering a brighter outlook for the market's future.

Ready to trade our S&P 500 analysis? Here’s a list of some of the best CFD trading brokers to check out.

