Top Forex Brokers
Bullish view
- Buy the BTC/USD pair and a take-profit at 37,000.
- Add a stop-loss at 34,500.
- Timeline: 1-2 days.
Bearish view
- Set a sell-stop at 35,000 and a take-profit at 34,000.
- Add a stop-loss at 36,000.
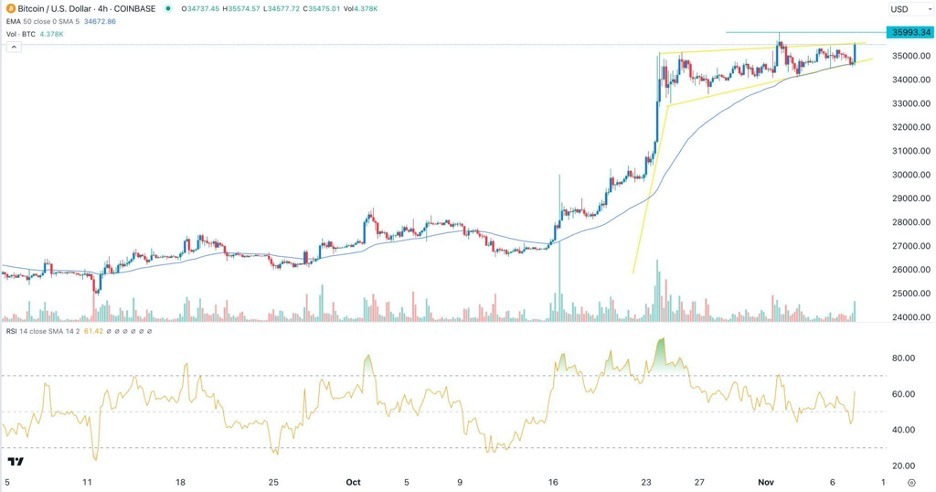
Bitcoin price was flat on Wednesday even as the US dollar index (DXY) bounced back. The BTC/USD pair was trading at 35,370 close to the year-to-date high of 36,000. It has risen by over 33% from the lowest level in October.
US dollar index rebound
The US dollar index rose in the overnight session as American bond yields pulled back. The index, which tracks the greenback against a basket of currencies, rose to $105.60. At the same time, the 10-year and 30-year bond yields dropped to 4.56% and 4.7%. The 5-year yield fell to 4.57%.
Bitcoin also consolidated as American stocks continued rising. The Dow Jones index rose by 62 points while the Nasdaq 100 and S&P 500 rose by 20 and 150 points. These indices are having their longest bull run since 2021.
Bitcoin has done well for several reasons. First, there are rising hopes that the Federal Reserve has finished hiking interest rates. In its decision last week, the Fed decided to leave rates unchanged between 5.25% and 5.50%.
With inflation easing, economists expect the bank will leave rates intact. Federal Reserve Chairman, the head of the Federal Reserve, will deliver a statement later on Wednesday.
Second, there are signs that the Securities and Exchange Commission (SEC) will approve a spot Bitcoin ETF in the coming months. Companies like Blackrock, Frederick Templeton, and Ark Invest have applied for a spot Bitcoin ETF.
Further, Bitcoin is doing well, helped by the upcoming halving, which will happen in late April. Historically, Bitcoin tends to do well ahead of a halving event. Halving reduces Bitcoin rewards by half.
Meanwhile, a Bloomberg analysis shows that more Bitcoin mining sold more Bitcoins in October than they mined. They sold these coins to benefit with the rising BTC prices.
BTC/USD technical analysis
The BTC/USD pair has been in a tight range in the past few weeks. It has consolidated at the important resistance point at 35,000. The pair has moved above the 50-period moving average while the Relative Strength Index (RSI) has drifted upwards.
Further, the pair has formed a bullish pennant pattern, which is shown in yellow. Volume has drifted upwards in the past few days. Therefore, with the pennant nearing the confluence level, there is a likelihood that it will have a bullish breakout to 37,000.
 Ready to trade our free trading signals? We’ve made a list of the best UK forex brokers worth using.

