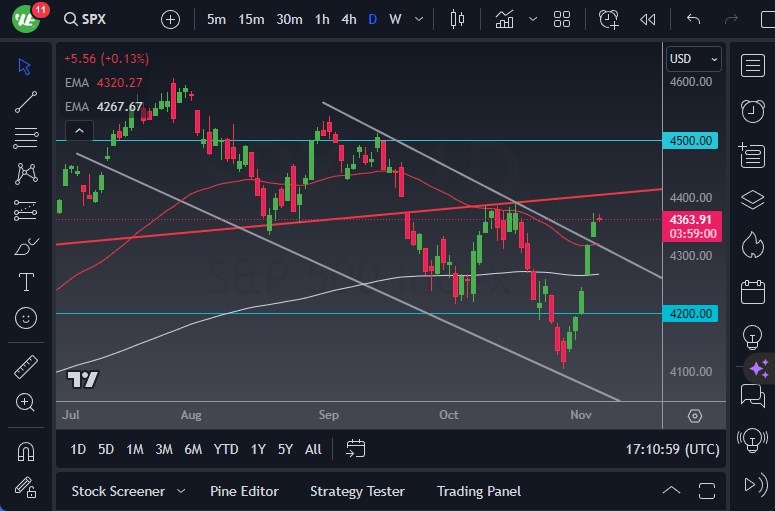
- The past week has witnessed a noteworthy rally in the S&P 500, and it presently resides near the apex of a descending channel, conspicuously positioned above the 50-Day EMA.
- However, it's crucial to acknowledge that this zone has historically posed as a formidable resistance area, hinting at the likelihood of an impending market reaction.
Top Forex Brokers
A noteworthy factor that had been exerting downward pressure on the S&P 500, until quite recently, was the performance of the US dollar. The preceding week witnessed a starkly negative performance for the US dollar, marking only the third instance of a weekly decline in the past eleven weeks. Thus, it becomes evident that a substantial transformation in market dynamics remains somewhat elusive at this juncture, especially there can also be the occasional headline out there could come into the picture and cause mayhem.
The paramount question that looms large is the prospective trajectory of the S&P 500. This is a focal point garnering considerable attention, as the force of gravity is bound to reassert itself sooner or later. The prevailing conditions manifest an exceedingly overbought scenario, and even in the event of a continued ascent, a retracement appears logical to attract fresh buyers. A pullback at least towards the 50-Day EMA seems reasonable, and potentially even a retracement to the 200-Day EMA could be on the horizon. It's imperative to exercise caution if the market embarks on an abrupt vertical surge, as chasing a market that has already undertaken a substantial portion of its journey may not be judicious.
Waiting for Inflation Data
The outlook for the stock market's ability to retain these gains for substantial advances remains tethered to a significant drop in the 10-year yield in the United States. Notably, Wall Street exhibited premature enthusiasm about the prospect of the Federal Reserve altering its monetary policy, a move that the Federal Reserve has yet to seriously contemplate. The impending release of inflation data next week adds another layer of uncertainty to the equation.
Moreover, it's worth bearing in mind that a mere seven stocks collectively constitute approximately 30% of the S&P 500. In essence, the S&P 500 effectively functions as an ETF comprising the most dominant mega-cap entities in the realm of Wall Street. In other words, you can never actually look at this through the prism of the entire market. This is the illusion of the weighted indices.

Ready to trade our S&P 500 analysis? Here’s a list of some of the best CFD trading brokers to check out.
