Top Forex Brokers
My previous BTC/USD signal on 11th December was not triggered, as there was no bullish price action when any of the support levels were first reached that day.
Today’s BTC/USD Signals
Risk 0.75% per trade.
Trades must be entered before 5pm Tokyo time Tuesday.
Long Trade Ideas
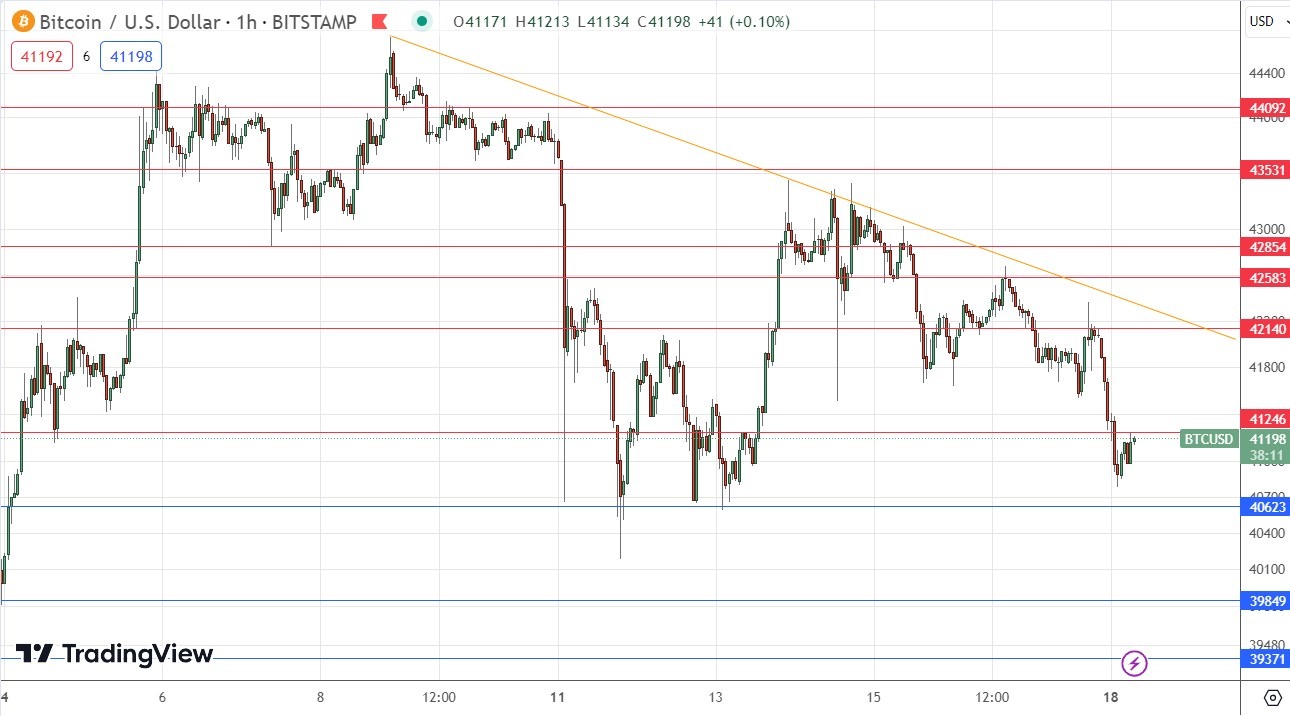
- Long entry after a bullish price action reversal on the H1 timeframe following the next touch of $40,623, $39,849, or $39,371.
- Place the stop loss $100 below the local swing low.
- Adjust the stop loss to break even once the trade is $100 in profit by price.
- Remove 50% of the position as profit when the trade is $100 in profit by price and leave the remainder of the position to run.
Short Trade Ideas
- Short entry after a bearish price action reversal on the H1 timeframe following the next touch of $41,246, $42,140, or $42,583.
- Place the stop loss $100 above the local swing high.
- Adjust the stop loss to break even once the trade is $100 in profit by price.
- Remove 50% of the position as profit when the trade is $100 in profit by price and leave the remainder of the position to run.
The best method to identify a classic “price action reversal” is for an hourly candle to close, such as a pin bar, a doji, an outside or even just an engulfing candle with a higher close. You can exploit these levels or zones by watching the price action that occurs at the given levels.
BTC/USD Analysis
I wrote in my previous BTC/USD analysis last Monday that Bitcoin might be a good long-term buy at support, but the drop from the highs printed several new resistance levels which may be hard to break. So, I saw the best approach might be to enter any bounces off support as long trades but be prepared to treat them like short-term trades if they do not perform well quickly.
This was a good call, as the price action has continued to be mostly bearish, but we do see strong support holding a bit lower than I was expecting last week, at $40,623. This level might still be a good place for a long-term buy as it is a little confluent with the big round number at $40k. However, the price chart below shows bearish price action bear the recent long-term highs, capped by a firmly descending trend line which seems to be pushing the price down.
I will still look for a firm bounce at $40,623 for a cautious long trade entry, but traders might want to be very cautious with this depending upon their risk appetite. More cautious traders may prefer waiting for a breakout signalled by a daily close above $44k which makes a new long-term high price.
On the other hand, due to its confluence with the bearish trend line, a short trade from a bearish reversal at $42,140 also looks attractive.

There is nothing of high importance scheduled today regarding the US Dollar.
Ready to trade our daily Bitcoin signals? Here’s our list of the best crypto brokers worth reviewing.

