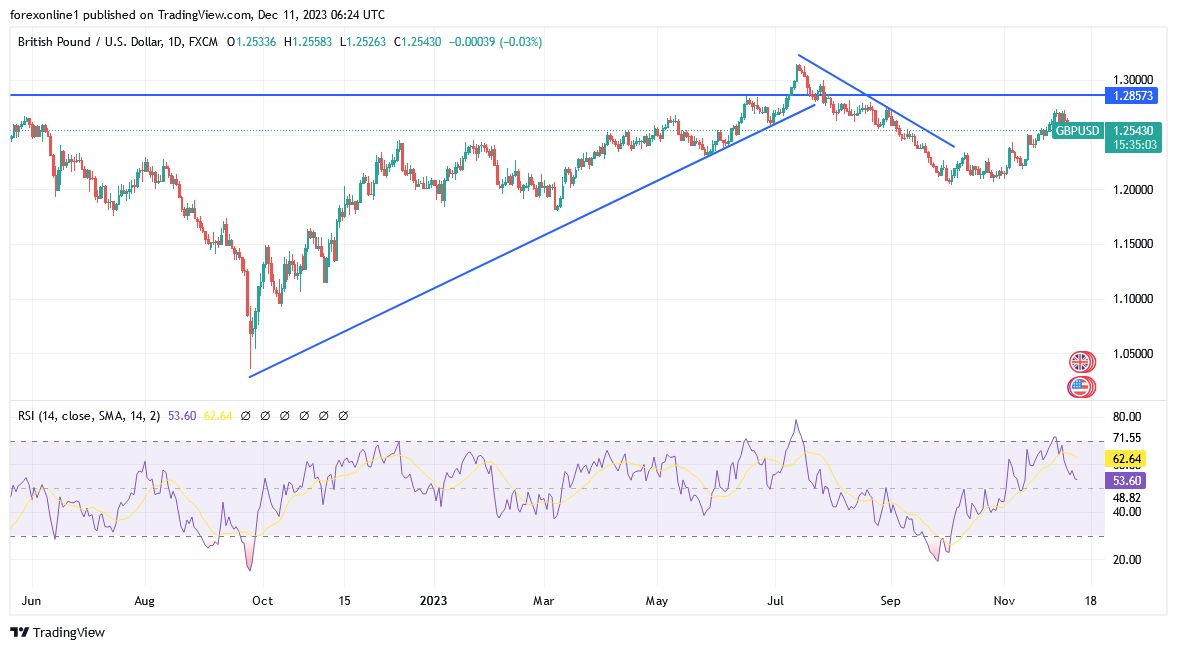
At the end of last week's trading, the pound sterling against the dollar (GBP/USD) fell by one-third of a percent following news that the US economy added a total of 199,000 jobs in the non-agricultural sector in November. Clearly, that’s exceeding market expectations of 180,000 and representing a significant rebound from 150,000 in October. As a result, the pound sterling continued its downward trajectory with losses reaching the support level of 1.2502. before closing the weekly trading, around the level of 1.2546, giving up the gains of the first month around the resistance level of 1.2725.
Top Forex Brokers
In general, there has been a preference for buying the US dollar as the implicit market expectations for the first rate cut by the US Federal Reserve in 2024 have declined, supporting bond yields.
Furthermore, For the Fed to consider cutting US interest rates in the coming months, policymakers will likely require that the unemployment rate trend higher. thus, this would imply easing labor market conditions. Moreover, the US labor market is tight, and wages are also surprising: average hourly earnings rose 0.4% month-on-month in November, beating estimates of 0.3% and accelerating from October's 0.2%.
Overall, the Fed will be concerned that the labor market is tight enough to keep wage rates high, ensuring that inflation remains above the 2.0% target for an extended period. Recently, the data confirmed the Federal Reserve's message that US interest rates should remain high for a longer period, which ultimately supports US bond yields and the dollar. Moreover, the economic data is not enough to indicate any major shift that should be expected from the Fed. Thus, it is enough to confirm that the recent upward trend in sterling is over, at least for the time being.
GBP/USD Expectations and Analysis Today:
According to the performance on the hourly chart, the price of the GBP/USD formed lower highs and lower levels within a descending channel, and it appears that another test of resistance is underway. Technically, The Fibonacci retracement tool shows additional levels that sellers can enter. Also, the 38.2% Fibonacci level is located near the top of the channel and a dynamic inflection point at the 100 SMA, so it may be enough to keep gains under control. Moreover, the largest correction may reach the 50% Fibonacci level at 1.2835 or the 61.8% level at 1.2656.
In the near term, the 100 SMA is below the 200 SMA to confirm that the overall trend has turned bearish or that selling is likely to gain momentum rather than reverse. Nearby, the 200 SMA lines up with the 50% Fibonacci level adding to its strength as a ceiling as well. On the other hand, the stochastic has room to rise before it reverses overbought levels, but the oscillator appears to be ready to turn lower already to indicate that the bears are keen to take control.
Furthermore, the RSI also appears to be peaking short of overbought territory, so downward pressure could return soon and take GBP/USD to a low of 1.2544 or lower. Moreover, according to the performance on the daily chart, breaking the support 1.2480 will definitely change the trend to bearish. During that period of time, a return to the resistance level of 1.2750 will be important for bulls to control and prepare for the psychological peak of 1.3000.
Finally, the performance of the GBP/USD price this week depends on the announcement of US inflation figures. Also. It would depend on announcements of policy decisions by both the US Federal Reserve and the Bank of England.

Ready to trade our daily Forex analysis? We’ve made this UK forex brokers list for you to check out.
