Top Forex Brokers
Bearish view
- Sell the GBP/USD pair and set a take-profit at 1.2450.
- Add a stop-loss at 1.2730.
- Timeline: 1-2 days.
Bullish view
- Set a buy-stop at 1.2600 and a take-profit at 1.2730.
- Add a stop-loss at 1.2480.
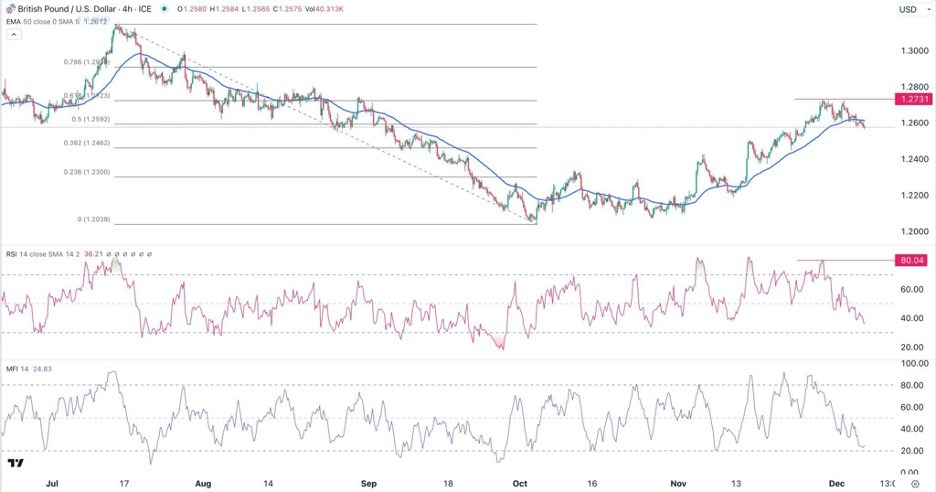
The GBP/USD price continued its downward trend as UK and US bond yields and crude oil prices slipped. The pair retreated to a low of 1.2572, a few points below this month’s high of 1.2731 ahead of the latest US jobs numbers.
UK and US bond yields retreat
The sterling has been under pressure this week as traders reflected on the hawkish statement by Jerome Powell who warned that the bank could still hike interest rates in the coming months. He warned that inflation was stubbornly high and that it needs more evidence that it is falling.
The pair’s sell-off continued this week as UK gilt yields sold-off as bets that the Bank of England (BoE) will slash rates. The 10-year gilt yields fell below 4% for the first time since May this year. The futures market points to at least four rate cuts by the BoE.
Further, in the United States, the 10-year yield retreated to 4.116% while the 30-year fell to 4.28%. The spread between the 10 and 2-year yield widened to 41.37%. This performance is also a sign that the market expects that the Fed will start cutting rates as soon as in March.
The Fed Rate Monitor Tool estimates that the Fed will deliver at least four rate cuts in 2024. To do this, the Fed will focus on the upcoming economic numbers such as jobs and inflation.
On Wednesday, data by ADP revealed that the private sector created 103k jobs in November after adding 106k in December. That increase was lower than the median estimate of 130k.
The next key data to watch will be the upcoming US NFP data. Economists polled by Reuters expect the data to reveal that the economy added 180k jobs in November while the unemployment rate remained at 3.9%.
GBP/USD technical analysis
The GBP/USD pair formed a small double-top pattern this month. In price action, this pattern is one of the most bearish signs. It has now moved below the 50-period Exponential Moving Average (EMA) and the 50% Fibonacci Retracement point.
The Relative Strength Index (RSI) has moved from last week’s high of 80 to the current 35. Also, Money Flow Index (MFI) is also nearing the oversold level. Therefore, the pair will likely continue falling with the next reference level to watch being the 38.2% retracement point at 1.2460.
 Ready to trade our free trading signals? We’ve made a list of the best UK forex brokers worth using.

