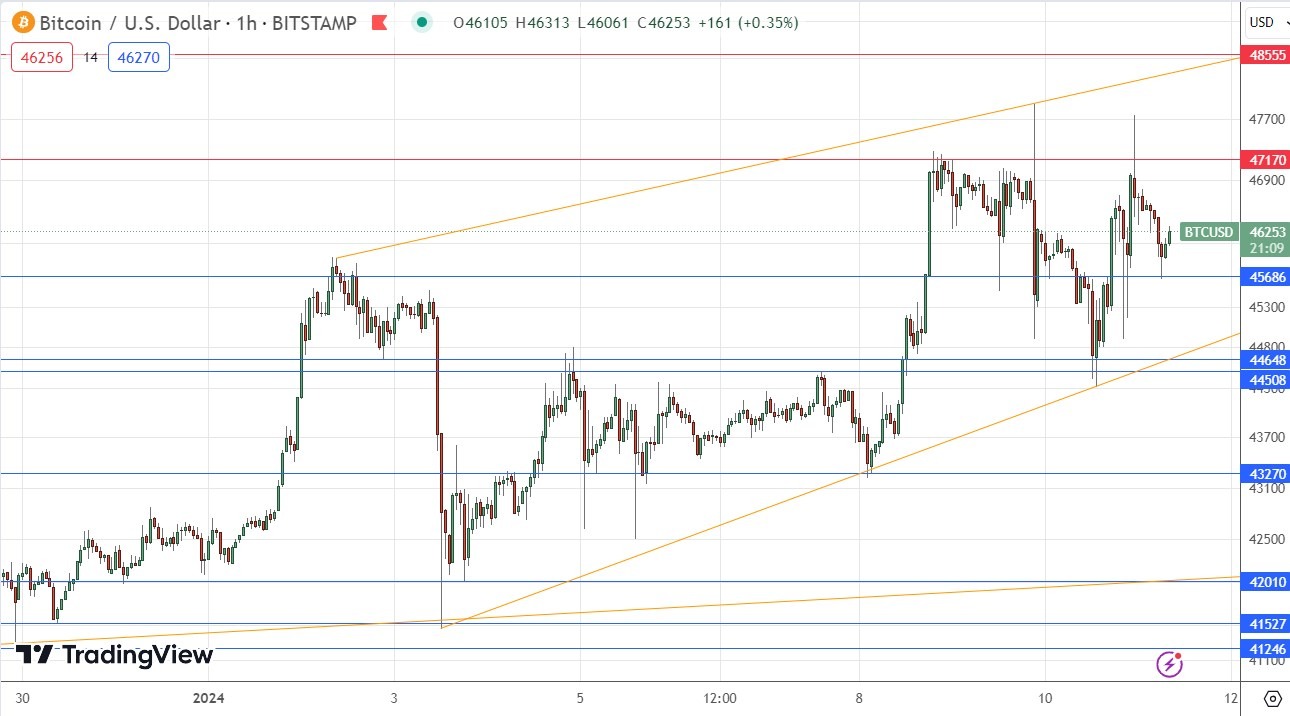
My previous BTC/USD signal on 4th January produced an excellent, nicely profitable long trade from the hourly inside bar which rejected the key support level identified at $41,709.
Today’s BTC/USD Signals
Risk 0.75% per trade.
Trades must be entered before 5pm Tokyo time Friday.
Long Trade Ideas
- Long entry after a bullish price action reversal on the H1 timeframe following the next touch of $45,686, $44,648, or $44,508.
- Place the stop loss $100 below the local swing low.
- Adjust the stop loss to break even once the trade is $100 in profit by price.
- Remove 50% of the position as profit when the trade is $100 in profit by price and leave the remainder of the position to run.
Short Trade Idea
- Short entry after a bearish price action reversal on the H1 timeframe following the next touch of $47,170 or $48,555.
- Place the stop loss $100 above the local swing high.
- Adjust the stop loss to break even once the trade is $100 in profit by price.
- Remove 50% of the position as profit when the trade is $100 in profit by price and leave the remainder of the position to run.
The best method to identify a classic “price action reversal” is for an hourly candle to close, such as a pin bar, a doji, an outside or even just an engulfing candle with a higher close. You can exploit these levels or zones by watching the price action that occurs at the given levels.

BTC/USD Analysis
I wrote in my previous BTC/USD analysis on 4th January that Bitcoin’s technical picture
remained bullish for two reasons:
- The price was contained within a wide but symmetrical ascending price channel, which is a bullish sign.
- The price was clearly not far off the high of a long-term bullish trend.
This was a good call, as the price has continued to advance to new 20-month high prices, breaking bullishly out of its ascending price channel, and forming a new wedge pattern which is a kind of asymmetric price channel. Although this wedge could be seen as bearish, I cannot see it like this until the price breaks below the lower trend line, which is currently sitting at $44,648 confluent with a horizontal support level.
Top Forex Brokers
The price is showing new higher support and short-term bullish momentum. It looks likely to rise further but may well not do anything dramatic until after the US inflation data release which is due later today.
Another factor to consider concerning Bitcoin is that the US SEC finally gave regulatory approval to several investment firms to start offering Bitcoin ETFs to the public. This might open up the Bitcoin market to more investors and traders. Interestingly, the price was rising on the rumour, but did not break to a new long-term high after the fact. It could be that this does give bulls tailwind.
For all these reasons, I remain bullish on Bitcoin, but I really want to see the price make a new long-term high price before entering a long trade. More confident traders might enter from another bounce at support, notably at $45,686.
Regarding the US Dollar, there will be a release of US CPI (inflation) data at 1:30pm London time.
Ready to trade our daily Bitcoin signals? Here’s our list of the best Bitcoin brokers worth reviewing.

