Bearish view
- Set a sell-stop at 42,000 and a take-profit at 40,000.
- Add a stop-loss at 44,000.
- Timeline: 1-2 days.
Bullish view
- Set a buy-stop at 43,000 and a take-profit at 45,000.
- Add a stop-loss at 40,000.
Bitcoin remained in a tight range on Thursday moring as a somber mood engulfed the broader financial market. The BTC/USD pair price was trading at 42,500, where it has been stuck at since falling sharply last week. Other cryptocurrency prices also remained in a consolidation phase.
Consolidation continues
Bitcoin’s underperformance is in line with other assets like American, European, and Asian equities. The Dow Jones dropped by another 160 points on Wednesday while the Nasdaq 100 and S&P 500 indices fell by 40 and 165 points, respectively.
In Asia, the Hang Seng, KOSPI, and Nikkei 225 indices continued falling while top European indices like the DAX and CAC 40 also pulled back. This trend happened as traders embraced a risk-off sentiment as inflation remained sticky.
In the UK, inflation jumped to 4.0% in December while the core CPI rose to 5.1%. These numbers are both higher than the bank’s target of 2.0%. The same is happening in countries in Europe and the US, meaning that the much-anticipated interest rate cuts will not happen as soon as expected.
Inflation will likely be sticky for a while as the crisis in the Middle East escalates. Houthi rebels, who have been designated as a terror group, have continued targeting ships in the region. This has led to higher shipping prices.
These events matter because hopes that central banks will start cutting rates soon was one of the top reasons why Bitcoin and other cryptocurrencies rallied in 2023.
Bitcoin has also stalled as investors focus on inflow data to the recently approved spot Bitcoin ETFs. The most recent data shows that investors have continued moving assets to these funds but at a slower pace than expected. These funds have had over $870 million in inflows in the first three days of trading.
Top Forex Brokers
BTC/USD technical analysis
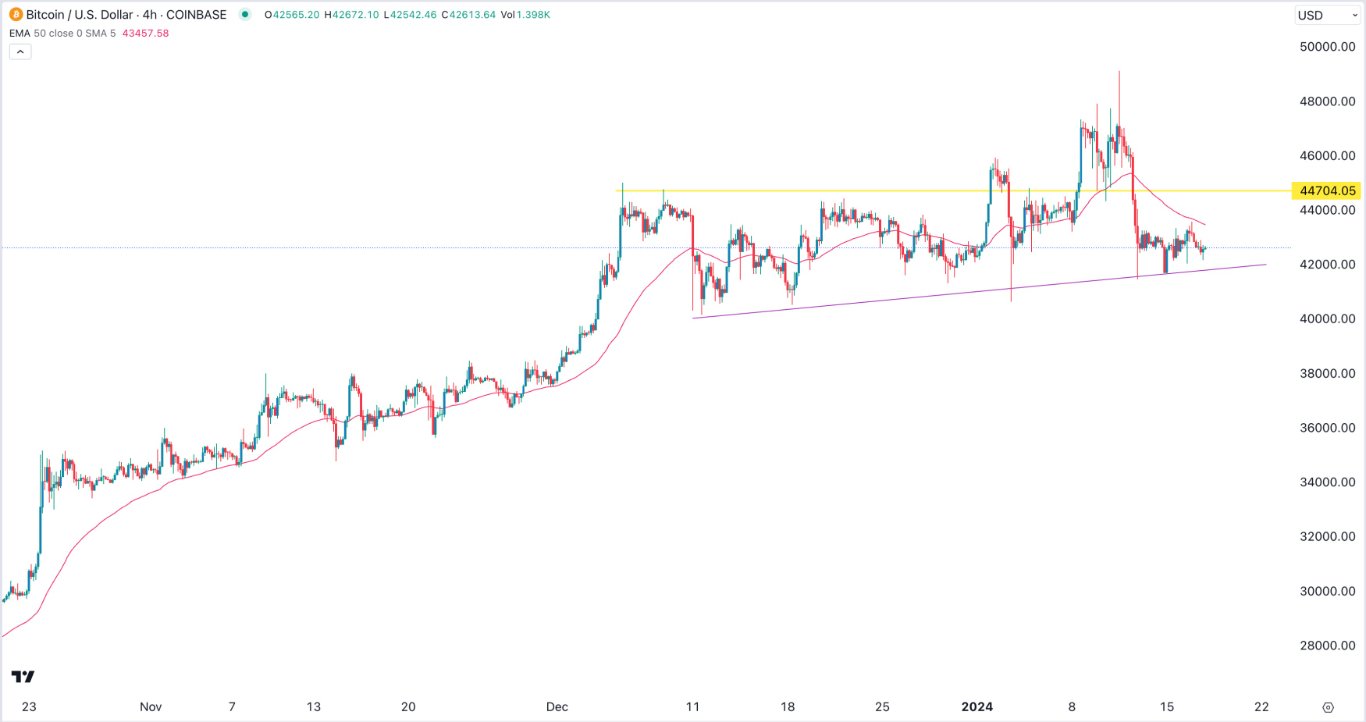
The 4H chart shows that the BTC/USD pair has been under pressure in the past few days. In this period, the pair has remained above the ascending purple trendline that connects the lowest swings since December 11th. It has moved slightly below the 50-period moving average while its volume has dropped from last week.
Therefore, the pair will likely continue remain in this consolidation phase in the coming days. More downside will be confirmed if the pair moves below the ascending trendline. If this happens, the pair will likely drop to 40,000. The alternative scenario is where the pair bounces back to 44,000.
Ready to trade our free trading signals? We’ve made a list of the best Forex crypto brokers worth trading with.


