The difference between success and failure in Forex / CFD trading is highly likely to depend on which assets you choose to trade each week and in which direction, and not on the methods you might use to determine trade entries and exits.
When starting the week, it is a good idea to look at the big picture of what is developing in the market as a whole and how such developments are affected by macro fundamentals, technical factors, and market sentiment.
Read on to get my weekly analysis below.
Fundamental Analysis & Market Sentiment
I wrote in my previous piece on 21st January that the best trade opportunity for the week was likely to be:
- Long of the NASDAQ 100 Index. This gave a win of 0.29%.
- Long of Cocoa Futures. This produced a win of 1.61%.
The overall result was a gain of 1.90% which comes to a gain of 0.80% per asset.
Last week saw much weaker directional volatility in the Forex market, with only one significant currency pair fluctuating by more than 1%. There was important action in stock markets, especially in the US and Japan. Last week again saw new all-time high prices reached by the benchmark S&P 500 Index and the Nasdaq 100 Index. The Japanese Nikkei 225 Index made a new 34-year high price.
This rise in stock markets occurred despite the CME’s FedWatch tool showing strongly lowering expectations of a March rate cut by the Federal Reserve. Markets now see only a 46% chance of a rate cut in March, and almost no chance of one at its meeting this week.
Although last week’s agenda was seemingly dominated by the policy meetings of three major central banks (the Bank of Japan, the European Central Bank, and the Bank of Canada), the real news was in the considerably stronger than expected US Advance GDP data, which showed the US economy roaring ahead and casts even more doubt on a March rate but by the Fed. All three central banks left rates unchanged, as expected, with no surprises except some dovish hints from the Bank of Canada which suggests a rate cut during Q2. The Bank of Japan slightly lowered its inflation forecast and maintained its ultra-loose monetary policy,
The Forex market was dominated by a strong Swiss Franc while other currencies were little changed over the week. The US Dollar is showing a little strength but has no real long-term trend and is prone to consolidation.
There were several other important economic data releases last week:
- US Core PCE Price Index – this increased by 0.2% month-on-month in line with expectations.
- US Advance GDP – this came in much stronger than expected, showing annualized growth over the past quarter at 3.3% when only 2.0% was anticipated.
- UK, German, French Flash Services & Manufacturing PMI – Services did well in the USA and the UK, while Manufacturing performed better in Germany and France.
- New Zealand CPI (inflation) – this came in exactly as expected.
- US Unemployment Claims – just slightly worse than expected.
The Week Ahead: 28th January – 2nd February
The most important items over the coming week will probably be the central bank policy meetings, with the US Federal Reserve and the Bank of England both meeting this week. However, neither bank is likely to cut rates, and there will also be important releases of German Preliminary CPI and US Non-Farm Payrolls and Average Earnings data which will likely make this coming week significant.
Other major economic data releases this week will be, in likely order of importance:
- US JOLTS Job Openings
- US CB Consumer Confidence
- US Revised UoM Consumer Sentiment
- Australian CPI (inflation)
- Canadian GDP
- Chinese Manufacturing PMI
- US ISM Manufacturing PMI
- US Employment Cost Index
- US Unemployment Claims
Monthly Forecast January 2024
Let us look at the relevant data of currency price changes and interest rates to date, which I compiled using a trade-weighted index of the major global currencies:

For the month of January, I forecasted that the EUR/USD would rise in value, and that the USD/JPY currency pair would fall in value. The performance of this forecast so far is:

Weekly Forecast 28th January 2024
Last week, I made no weekly forecast, as there were no strong counter-trend price movements in any currency crosses, which is the basis of my weekly trading strategy.
I again have no forecast this week.
Directional volatility in the Forex market decreased last week with only 4% of the most important currency pairs fluctuating by more than 1%. Volatility is likely to increase over the coming week, as such a low level of volatility is unusual, and there are several important data releases scheduled.
Last week was dominated by relative strength in the Swiss Franc, and relative weakness in the Euro.
You can trade my forecasts in a real or demo Forex brokerage account.
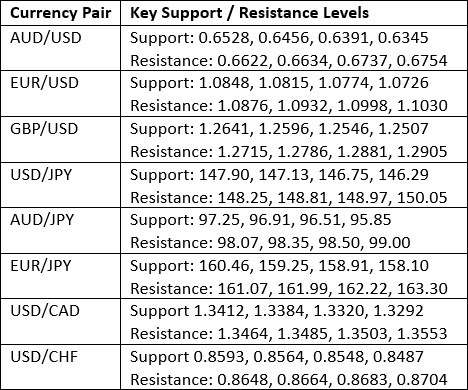
Key Support/Resistance Levels for Popular Pairs
I teach that trades should be entered and exited at or very close to key support and resistance levels. There are certain key support and resistance levels that can be monitored on the more popular currency pairs this week.
Technical Analysis
US Dollar Index
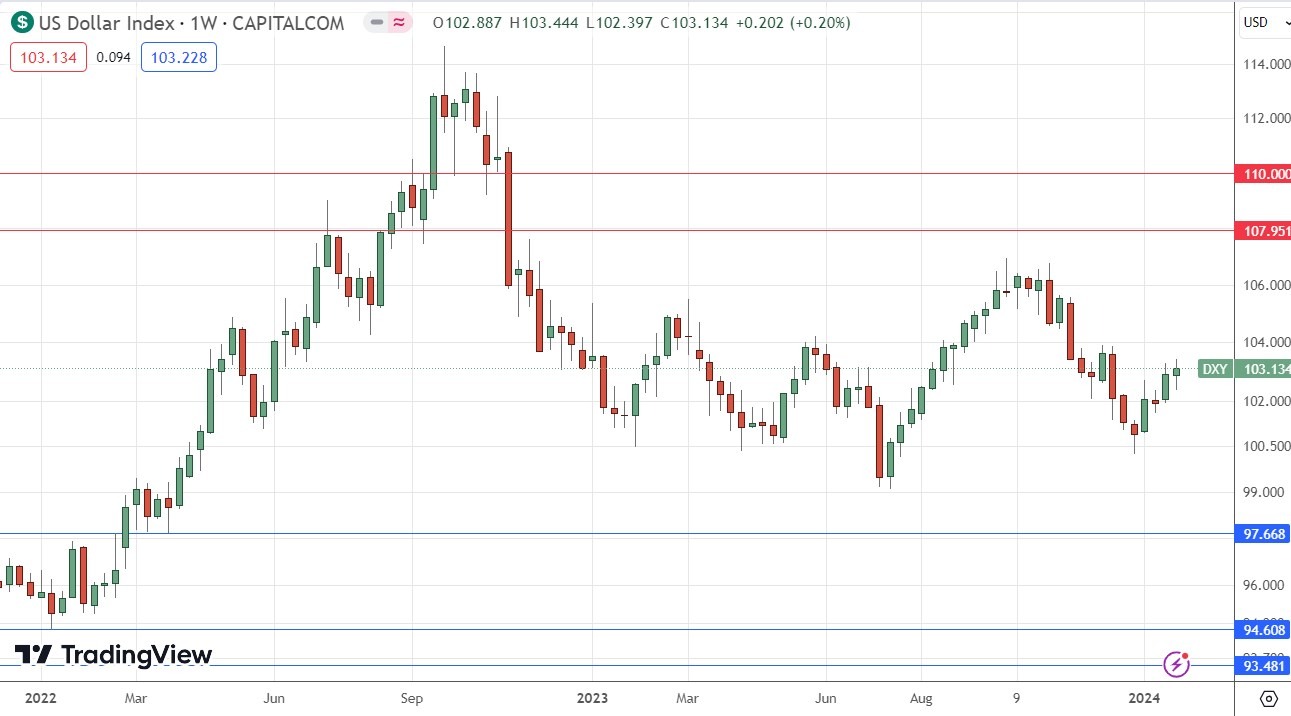
The US Dollar Index printed a small bullish candlestick last week, which displays only a little bullish momentum. The weekly close was down on the price of 3 months ago but up on the price of 6 months ago, presenting a mixed long-term trend.
Due to this mixed technical picture, I cannot take a position on the US Dollar as a trend trader, so trading Forex this week it will probably be best to take a short-term, opportunistic approach based upon day-to-day sentiment, while relying on strength or weakness in other currencies beyond the greenback.
NASDAQ 100 Index
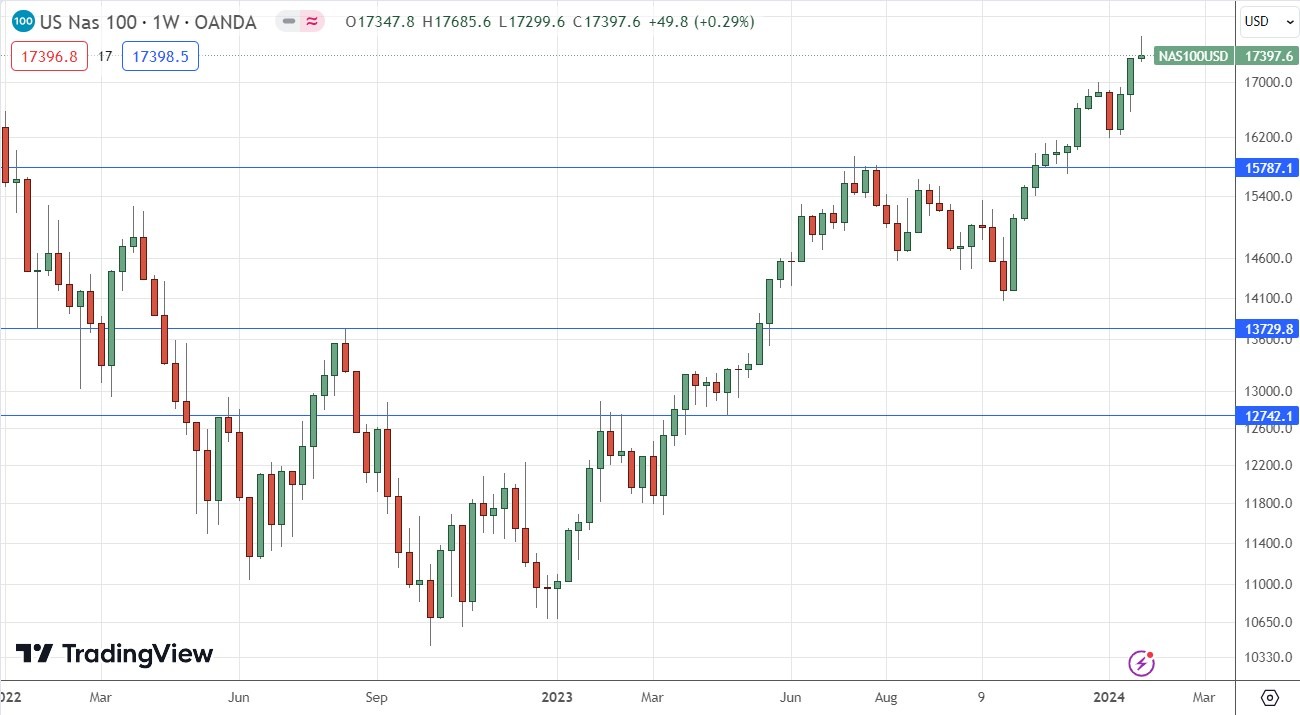
The NASDAQ 100 Index rose week to reach and close at new all-time highs but gave up most of its earlier gains as the week went on to print what could be considered a bearish pin bar. This happened at the same time as the broader-based benchmark S&P 500 Index also broke to a new record high for the first time in two years. Interestingly, the broader S&P 500 Index made a more bullish weekly close than the NASDAQ 100 did.
The technical picture is bullish long-term, but we are certainly seeing some short-term profit taking in tech. There are good reasons to hold a long position open in the bull market we are currently in, but the price may have to drop a bit further before it will start to rise convincingly again.
S&P 500 Index
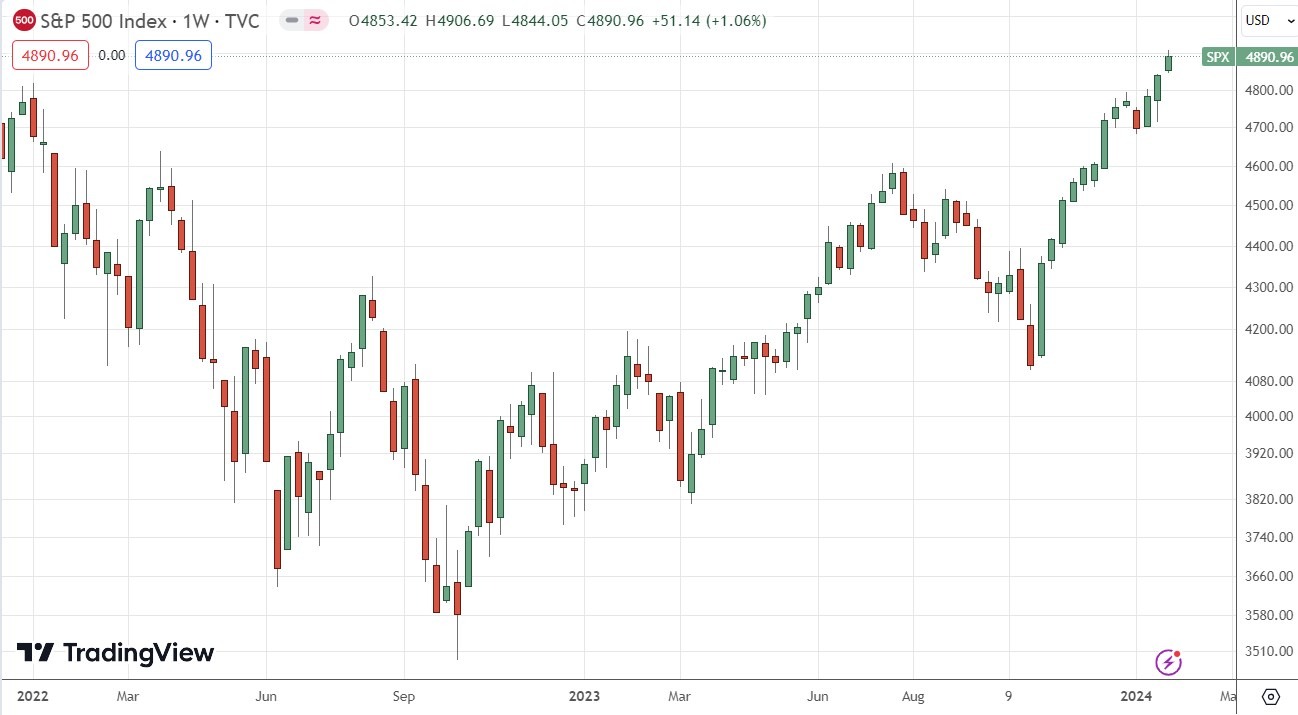
The S&P 500 Index rose again last week to reach and close at new all-time highs. The previous week’s new record high was the first time this has happened in two years.
The weekly candlestick is of an average size and closed quite near its high, which is a bullish sign. It is a notably more bullish close than we saw in the NASDAQ 100 Index.
This bullishness in US stock markets is a little strange as it comes at the same time as short-term US treasury yields and the US Dollar are rising in value, while expectations of a rate cut by the Federal Reserve in March are continuing to fall. These factors typically weaken US stock markets. It may be that the US economy is just looking so much more impressive than its competitors right now, that an inflow of foreign investment is coming into the US stock market. This may be evidenced by last week’s Advance US GDP print of 3.3%, well ahead of the 2.0% which was expected. However, this also raises the expectation that the Fed will now be slower to cut rates.
The technical picture is bullish. A first break to a fresh all-time high has historically generated an advance of a median 13% over the next year, so traders and investors should be seriously considering going long here.
EUR/USD
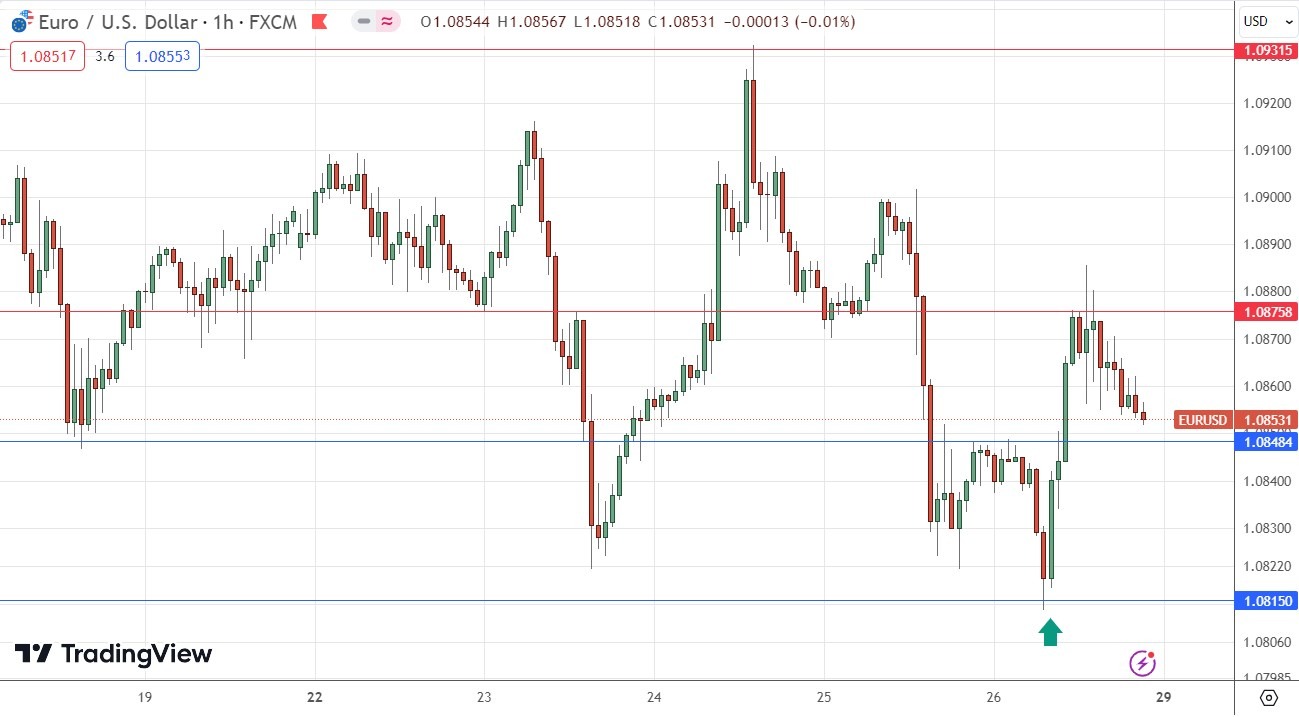
I had expected the level at $1.0815 might act as support in the EUR/USD currency pair last week, as it had acted previously as both support and resistance. Note how these “role reversal” levels can work well. The H1 price chart below shows how the price rejected this level right at the start of last Friday’s London session with an engulfing candlestick, marked by the up arrow in the price chart below signaling the timing of this bullish rejection. This can be a great time of the day to trade a major Forex currency pair like this one. This trade was profitable, giving a maximum reward to risk ratio of more than 1 to 1 so far based upon the size of the entry candlestick structure.
USD/JPY
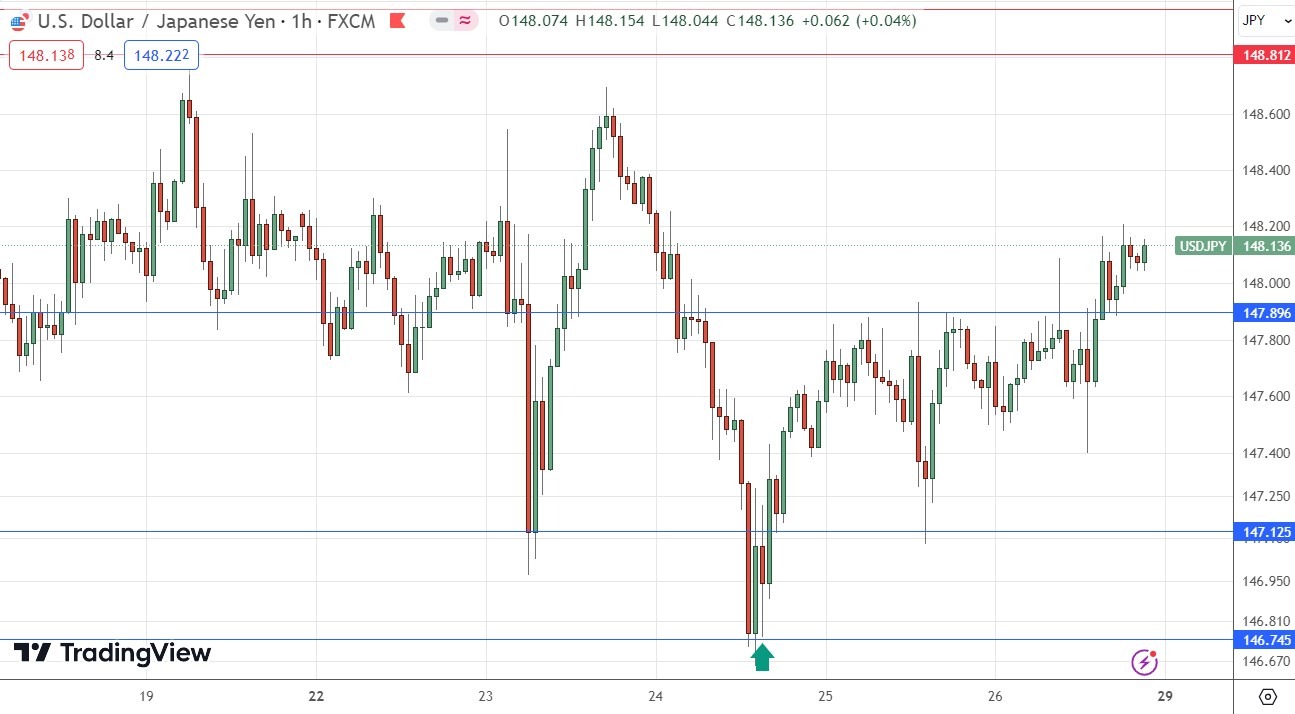
I had expected the level at ¥146.75 might act as support in the USD/JPY currency pair last week, as it had acted previously as both support and resistance. Note how these “role reversal” levels can work well. The H1 price chart below shows how the price rejected this level last Wednesday with an inside bar, marked by the up arrow in the price chart below signaling the timing of this bullish rejection. This took place during the London / New York session overlap which can be a great time of day to trade major Forex currency pairs. This trade was profitable, giving a maximum reward to risk ratio of almost 2 to 1 so far based upon the size of the entry candlestick structure.
AUD/JPY
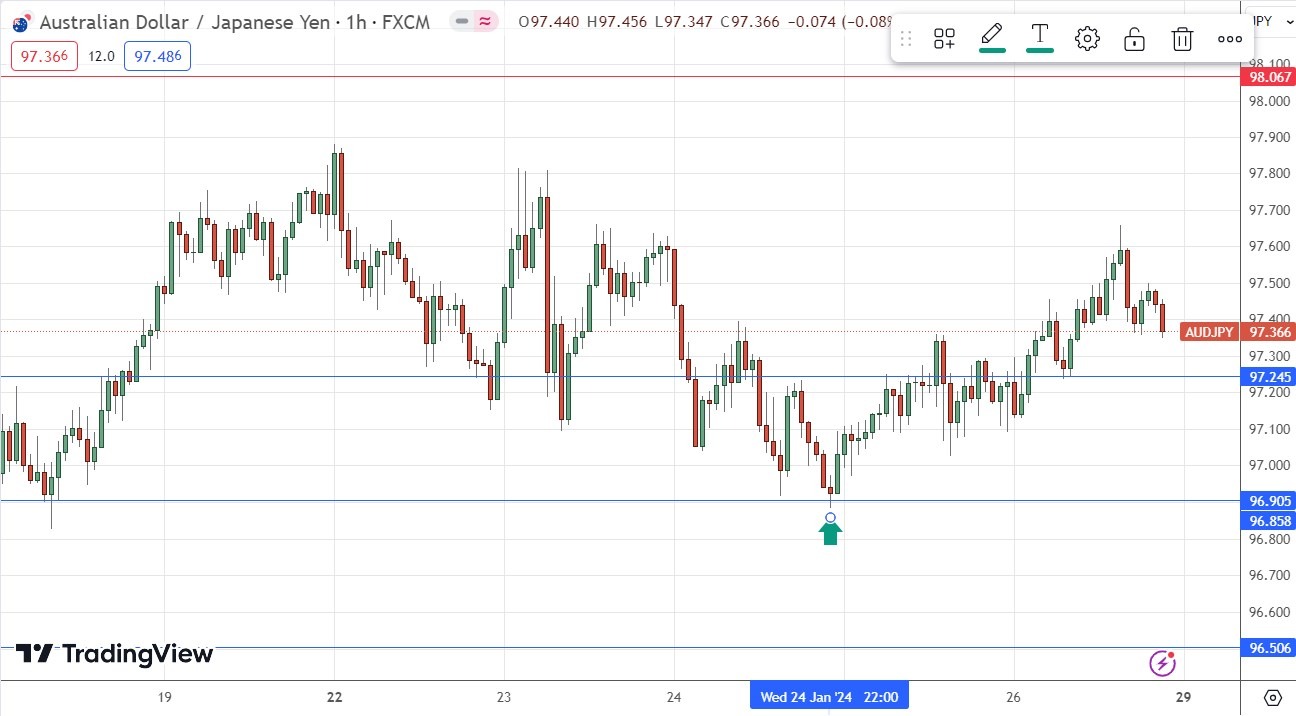
I had expected the level at ¥96.91 might act as support in the AUD/JPY currency cross last week, as it had acted previously as both support and resistance. Note how these “role reversal” levels can work well. The H1 price chart below shows how the price rejected this level just before the start of last Thursday’s Tokyo session with a doji, marked by the up arrow in the price chart below signaling the timing of this bullish rejection. This trade was nice profitable, giving a maximum reward to risk ratio of more than 5 to 1 so far based upon the size of the entry candlestick.
Cocoa Futures
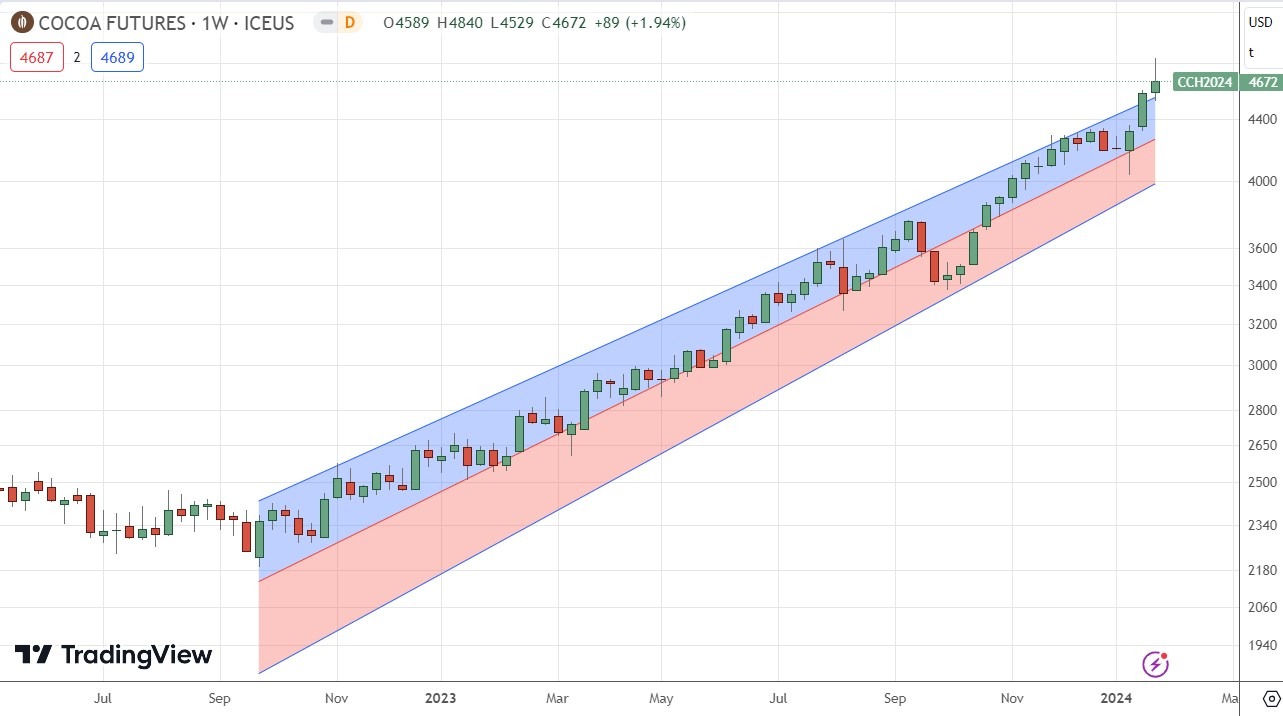
Cocoa futures have been in a strong bullish trend for over a year and last week the price again advanced strongly to reach a new multi-year high price, although it gave up most of its gains by the end of the week. The price chart below applies linear regression analysis to the past 71 weeks and shows graphically what a great opportunity this has been on the long side over the long term.
Despite the recent sharp dip, this strong trend shows no true sign of stopping. There is an ever-increasing global demand for this superfood cocoa and supply has been stretched over recent months.
Trading commodities long on breakouts to new 6-month highs has been a very profitable strategy over recent years, so I see this as a buy. However, it is worth noting that the price is outside the linear regression channel, so it may be worth waiting for a breakout to a new high to be sure this retracement is over.
Bottom Line
I see the best trading opportunities this week as:
- Long of the NASDAQ 100 Index following a daily close above 17686.
- Long of the S&P 500 Index.
- Long of Cocoa Futures following a daily close above 4840.
Ready to trade our Forex weekly analysis? We’ve shortlisted the best Forex trading brokers in the industry for you.
