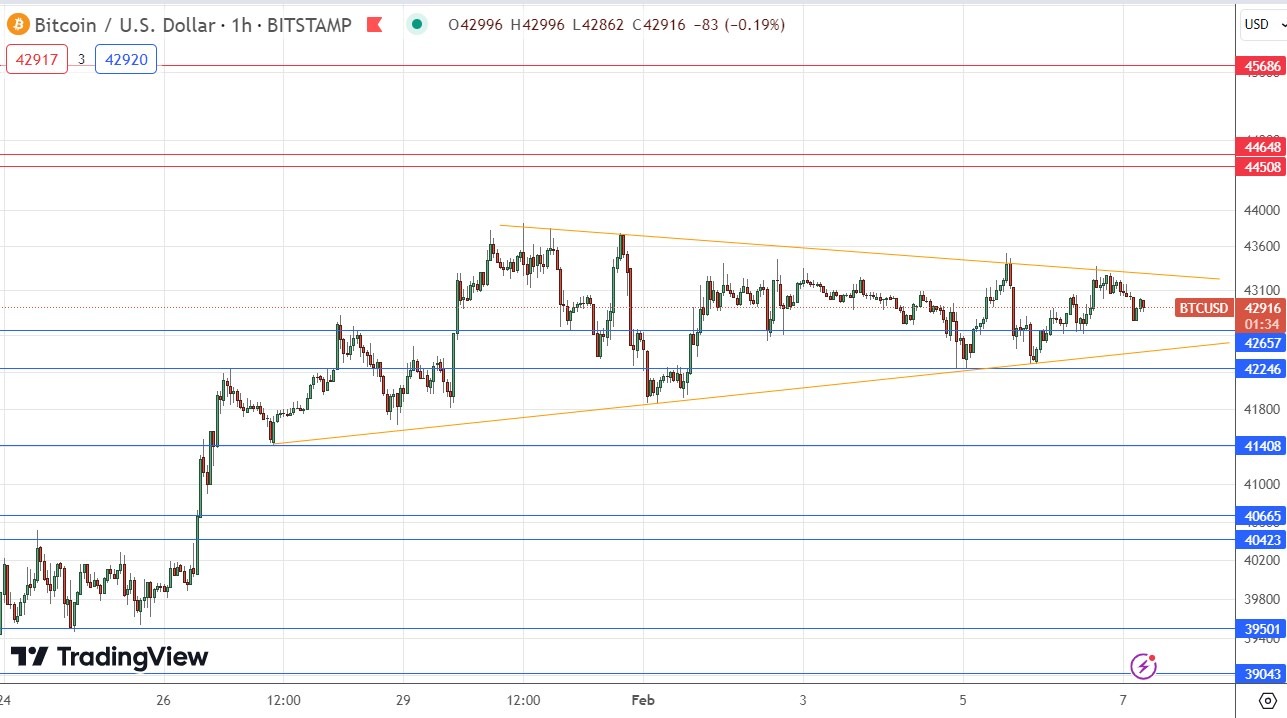
My previous BTC/USD signal on 1st February produced a losing short trade from the bearish rejection of the resistance level at $42,634.
Today’s BTC/USD Signals
- Risk 0.75% per trade.
- Trades may only be taken prior to 5pm Tokyo time Thursday.
Long Trade Ideas
- Go long after a bullish price action reversal on the H1 timeframe following the next touch of $42,657, $42,246, or $41,408.
- Put the stop loss $100 below the local swing low.
- Move the stop loss to break even once the trade is $100 in profit by price.
- Take off 50% of the position as profit when the trade is $100 in profit by price and leave the remainder of the position to ride.
Short Trade Ideas
- Go short after a bearish price action reversal on the H1 timeframe following the next touch of $44,508, $44,648, or $45,686.
- Put the stop loss $100 above the local swing high.
- Move the stop loss to break even once the trade is $100 in profit by price.
- Take off 50% of the position as profit when the trade is $100 in profit by price and leave the remainder of the position to ride.
The best method to identify a classic “price action reversal” is for an hourly candle to close, such as a pin bar, a doji, an outside or even just an engulfing candle with a higher close. You can exploit these levels or zones by watching the price action that occurs at the given levels.
Top Forex Brokers
BTC/USD Analysis
I wrote in my previous BTC/USD analysis almost one week ago that the technical picture had become more bearish, with the standout technical feature being the support level at $41,408, which looked like it was going to be a solid base.
This was a good call insofar as the price rose over most of the day, not even touching the support level, although in this case it was not an actionable analysis.
The technical picture now has become more bullish. In the price chart below, recent price action is contained within a narrowing triangle pattern. The pattern itself is relatively neutral, but as the price has been printing higher lows, overall, the formation looks bullish.
I think we are most likely to see a bullish breakout above this triangle, which could send the price higher to reach the next resistance level at $44,508.
If this breakout happens later today with a strongly bullish candlestick, it could be an interesting signal at which is enter a new long trade.
There is nothing of high importance scheduled today regarding the US Dollar.
Ready to trade our daily Bitcoin signals? Here’s our list of the best crypto brokers worth reviewing.


