Bullish view
- Buy the BTC/USD pair and set a take-profit at 53,500.
- Add a stop-loss at 49,145.
- Timeline: 1-2 days.
Bearish view
- Set a sell-stop at 51,000 and a take-profit at 49,000.
- Add a stop-loss at 43,500.
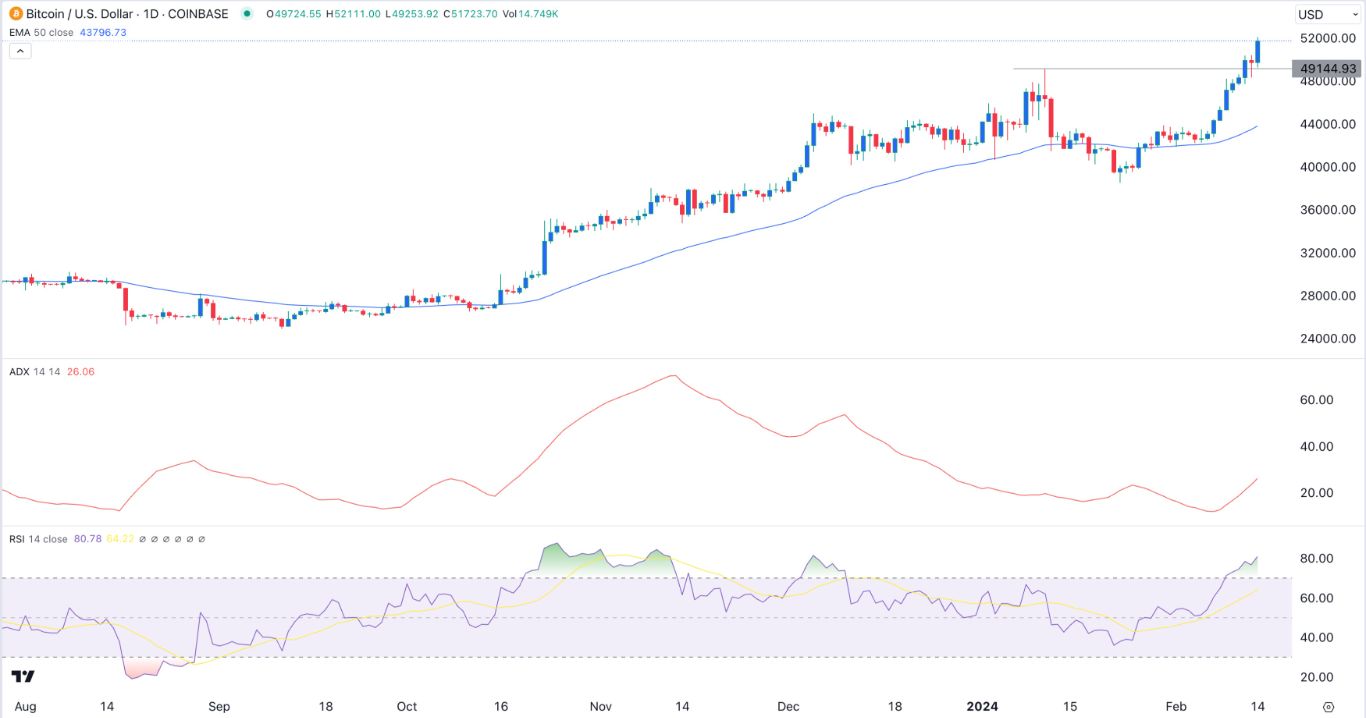
Bitcoin price continued its strong bull run as the ongoing inflows in the industry continued. The BTC/USD pair soared to a high of 52,000 on Thursday, meaning that it has surged by over 34% from its lowest point in January. Other cryptocurrencies also continued rising, with the total market cap of all coins hitting almost $2 trillion.
Bitcoin ETF inflows continue
The BTC/USD pair continued its bull run as investors cheered the ongoing inflows. Data shows that popular ETFs like the iShares Bitcoin ETF (IBIT) and Fidelity Wise Bitcoin ETF (FBTC) have seen over $6 billion in inflows in the past few weeks.
Most notably, data also shows that popular gold ETFs like the iShares Gold ETF (GLD) has seen significant outflows this year. This is a sign that some investors are moving from gold to Bitcoin, which is often seen as a digital version of gold. Bitcoin has a long track record of beating gold.
Top Forex Brokers
Bitcoin is also soaring because of the ongoing enthusiasm about the upcoming halving event. Halving, which will happen in April, will likely see the amount of Bitcoin produced each day fall from 900 to 450. This will happen at a time when many institutional investors are buying Bitcoins.
In most cases, Bitcoin tends to do well ahead of halving. It was trading at less than $50 when its first halving happened in 2012. By the time the next two halvings happened, the coin was trading at over $16,000 and $30,000, respectively.
The BTC/USD pair also jumped as the US dollar index pulled back on Thursday. The index was trading at $104.61, a few points below its highest point this week. This retreat happened as traders continued to reflect on Tuesday’s inflation data.
BTC/USD technical analysis
The daily chart shows that the BTC to USD pair has been in a strong uptrend in the past few months. It managed to cross the important resistance at 49,144, which was the highest swing after the SEC approved a spot Bitcoin ETF. Further, the pair moved above the psychological point at 50,000.
It has remained above the 50-day moving average while the Average Directional Index (ADX) has moved above 20, signaling that the bullish trend is still strong. The Relative Strength Index (RSI) has moved to the overbought level at 80, which is also a sign that there is a bullish momentum.
Therefore, the outlook for the pair is bullish, with the next reference level to watch being at 53,500. The stop-loss of this trade is at 49,144.
Ready to trade our free trading signals? We’ve made a list of the best Forex crypto brokers worth trading with.


