Bullish view
- Buy the BTC/USD pair and set a take-profit at 53,000.
- Add a stop-loss at 50,000.
- Timeline: 1-2 days.
Bearish view
- Set a sell-stop at 51,500 and a take-profit at 50,000.
- Add a stop-loss at 53,000.
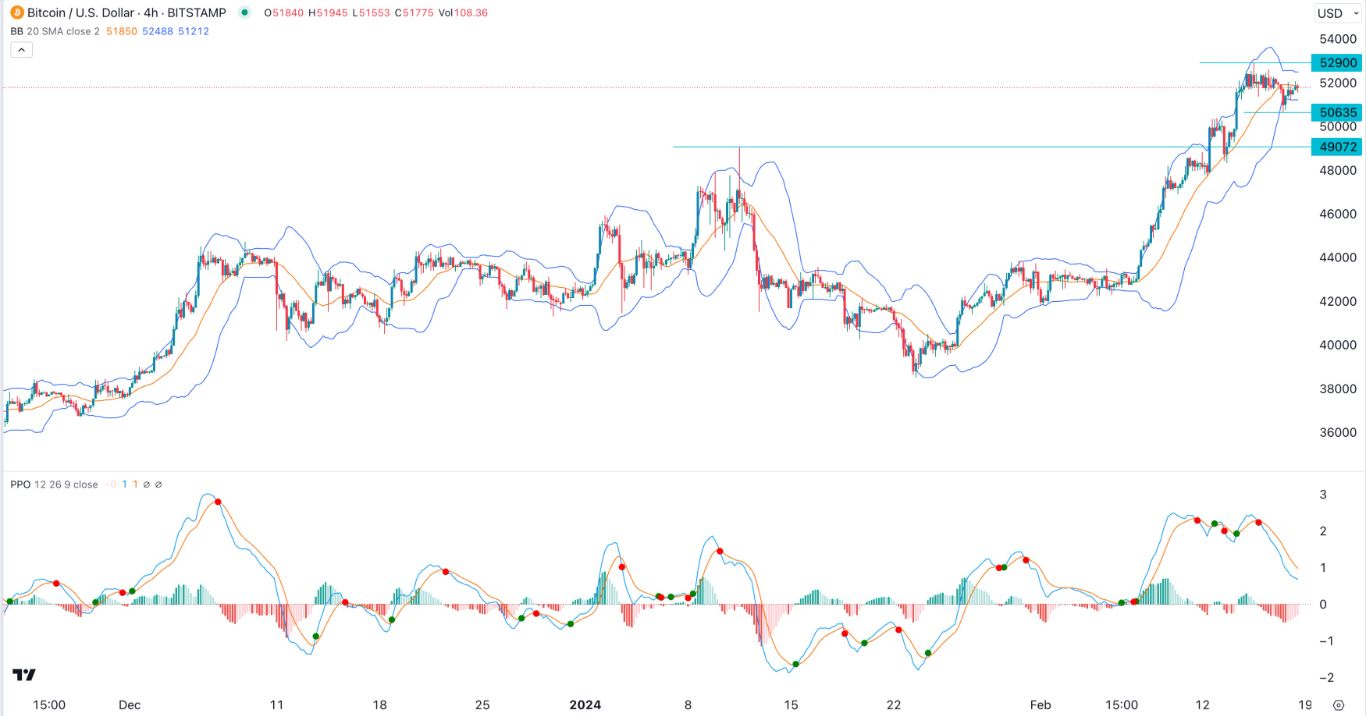
Bitcoin price continued its consolidation phase during the weekend as the recent momentum waned. The BTC/USD pair was trading at 52,000, where it has been in the past few days. Despite this price action, Bitcoin remains sharply higher than the year-to-date low of 38,450.
Traders wait for the next catalyst
Bitcoin has had a great year as investors cheered the approval of spot Bitcoin ETFs. While its price dropped after the approval, it has now bounced back and reached its highest level in more than two years.
The most recent catalyst for the BTC/USD pair was that some top ETFs were gaining substantial inflows. For example, the iShares Bitcoin ETF (IBIT) has seen its total assets jump to over $6 billion. Fidelity’s Wise Origin ETF has had its assets soar to over $2.1 billion.
Other top-performing ETFs were the Ark 21Shares Bitcoin ETF (ARKB) and Bitwise Bitcoin ETF (BITB). Notably, there are signs that some of these funds are flowing from the SPDR Gold ETF (GLD), which has had some strong outflows recently.
Top Forex Brokers
Bitcoin’s performance is also in line with that of America’s stock market, which has been in a strong uptrend this year. On Friday, the main indices like the Dow Jones, S&P 500, and Nasdaq 100 retreated even though they remained near their record highs.
A key reason for this price action is that hopes of a swifter rate cut by the Federal Reserve have faded recently. The US published strong jobs numbers earlier this month while inflation was hotter than expected.
Looking ahead, Bitcoin could continue powering on ahead of the halving event, which will happen in April. Halving is a situation where the block rewards are slashed into half in a bid to moderate the pace of supply growth.
BTC/USD technical analysis
The BTC/USD pair jumped to a high of two-year high of 52,900 last week and then pulled back sharply to 50,635. On the 4H chart, the pair has moved to the middle line of the Bollinger Bands indicator. The three bands have also narrowed recently in a sign that the volatility has faded.
The pair has also risen above the 50-period moving average while the Percentage Price Oscillator (PPO) have drifted downwards. Therefore, the outlook for the pair is neutral with a bullish bias. More upside will be confirmed if the price moves above last week’s high of 52,900.
Ready to trade our free Forex signals? Here are the best MT4 crypto brokers to choose from.


